Abstract
A database of the healthy human spinal cord morphometry in the PAM50 template space
Jan Valošek*1,2,3,4, Sandrine Bédard*1, Miloš Keřkovský5, Tomáš Rohan5, Julien Cohen-Adad1,2,6,7
- * Shared co-first authorship - authors contributed equally
- 1NeuroPoly Lab, Institute of Biomedical Engineering, Polytechnique Montreal, Montreal, QC, Canada
- 2Mila - Quebec AI Institute, Montreal, QC, Canada
- 3Department of Neurosurgery, Faculty of Medicine and Dentistry, Palacký University Olomouc, Olomouc, Czechia
- 4Department of Neurology, Faculty of Medicine and Dentistry, Palacký University Olomouc, Olomouc, Czechia
- 5Department of Radiology and Nuclear Medicine, University Hospital Brno and Masaryk University, Brno, Czechia
- 6Functional Neuroimaging Unit, CRIUGM, Université de Montréal, Montreal, QC, Canada
- 7Centre de Recherche du CHU Sainte-Justine, Université de Montréal, Montreal, QC, Canada
Abstract#
Measures of spinal cord morphometry computed from magnetic resonance images serve as relevant prognostic biomarkers for a range of spinal cord pathologies, including traumatic and non-traumatic spinal cord injury and neurodegenerative diseases. However, interpreting these imaging biomarkers is difficult due to considerable intra- and inter-subject variability. Yet, there is no clear consensus on a normalization method that would help reduce this variability and more insights into the distribution of these morphometrics are needed. In this study, we computed a database of normative values for six commonly used measures of spinal cord morphometry: cross-sectional area, anteroposterior diameter, transverse diameter, compression ratio, eccentricity, and solidity. Normative values were computed from a large open-access dataset of healthy adult volunteers (N = 203) and were brought to the common space of the PAM50 spinal cord template using a newly proposed normalization method based on linear interpolation. In comparison to traditional image-based registration, the proposed normalization approach does not involve image transformations and, therefore, does not introduce distortions of spinal cord anatomy. This is a crucial consideration in preserving the integrity of the spinal cord anatomy in conditions such as spinal cord injury. This new morphometric database allows researchers to normalize based on sex and age, thereby minimizing inter-subject variability associated with demographic and biological factors. The proposed methodology is open-source and accessible through the Spinal Cord Toolbox (SCT) v6.0 and higher.
1. INTRODUCTION#
1.1 Spinal cord morphometry measures#
The spinal cord plays a vital role in the central nervous system by transmitting sensory and motor signals between the brain and the rest of the body. It also contains essential networks responsible for functions such as locomotion and pain processing. Structural magnetic resonance imaging (MRI) is commonly used to assess spinal cord macrostructure and to compute measures of spinal cord morphometry like cross-sectional area (CSA) or anteroposterior (AP) diameter. The morphometric measures serve as objective indicators to evaluate spinal cord pathologies, such as the extent of spinal cord atrophy in multiple sclerosis [Losseff et al., 1996, Mina et al., 2021, Rocca et al., 2019] and amyotrophic lateral sclerosis [El Mendili et al., 2023, Paquin et al., 2018] or the severity of spinal cord injury and spinal cord compression in traumatic and non-traumatic spinal cord injury, respectively [Badhiwala et al., 2020, David et al., 2019, Miyanji et al., 2007].
However, interpreting morphometric measures is challenging due to considerable inter-subject variability associated with demographic and biological factors. For example, significantly smaller CSA is consistently reported in females relative to males [Bédard and Cohen-Adad, 2022, Engl et al., 2013, Mina et al., 2021, Papinutto et al., 2020, Papinutto et al., 2015, Rashid et al., 2006, Solstrand Dahlberg et al., 2020, Yanase et al., 2006]. Similarly, studies showed an association of spinal cord CSA with cervical cord length [Martin et al., 2017, Martin et al., 2017, Oh et al., 2014], spinal canal area, and spinal canal diameters [Kesenheimer et al., 2021, Papinutto et al., 2020]. Other factors, such as brain volume, intracranial volume, and thalamic volume also showed a strong correlation with spinal cord CSA [Bédard and Cohen-Adad, 2022, Papinutto et al., 2020, Rashid et al., 2006, Solstrand Dahlberg et al., 2020].
As for weight and height, studies showed only a moderate correlation with spinal cord CSA [Papinutto et al., 2020, Yanase et al., 2006] or did not show any significant association [Bédard and Cohen-Adad, 2022, Papinutto et al., 2020, Solstrand Dahlberg et al., 2020]. Likewise, only a weak non-significant association was reported between spinal cord CSA and age [Bédard and Cohen-Adad, 2022, Kato et al., 2012, Papinutto et al., 2020, Yanase et al., 2006]. A single study with a wide cohort age range reported that CSA increases until about 45 years of age and then begins to decrease [Papinutto et al., 2020].
In addition to inter-subject variability, spinal cord anatomy varies depending on the level. Corresponding with anatomical textbooks [Standring, 2020], studies have shown an increase in CSA around vertebral levels C4-C5 corresponding to cervical enlargement [De Leener et al., 2018, Frostell et al., 2016, Horáková et al., 2022, Martin et al., 2017, Mina et al., 2021, Rocca et al., 2019]. Then, the spinal cord cross-section becomes smaller, which is mirrored by the decrease in CSA.
1.2 Normalization strategies#
Various normalization strategies have been proposed to account for the above-mentioned factors on spinal cord morphometric measures. Sex was used for CSA normalization in several works [Bédard and Cohen-Adad, 2022, Kesenheimer et al., 2021, Papinutto et al., 2020, Rashid et al., 2006]. Other studies proposed spinal cord length as a normalization factor [El Mendili et al., 2023, Martin et al., 2017, Martin et al., 2017, Oh et al., 2014, Rocca et al., 2019]. Additionally, combining spinal cord length with a z-score normalization was proposed to account for variations along the superior-inferior axis [Martin et al., 2017, Martin et al., 2017]. Another approach taking into account the dependency of spinal cord anatomy on a level involved the normalization of morphometric measures from the compression site using non-compressed levels above and below [Guo et al., 2022, Miyanji et al., 2007]. Finally, several studies normalized CSA using the spinal canal and brain metrics, including spinal canal area, spinal canal diameter, brain volume, intracranial volume, thalamic volume, and head size normalization factor [Bédard and Cohen-Adad, 2022, Horsfield et al., 2010, Kesenheimer et al., 2021, Papinutto et al., 2020, Rashid et al., 2006, Rocca et al., 2019].
While normalization strategies showed promising outcomes, there is currently no accepted consensus on which method to use [Cohen-Adad et al., 2021, Papinutto et al., 2020], and their practical implementation may encounter several challenges. First, measuring the spinal cord length and the spinal canal area can be time-consuming due to the absence of reliable automatic measurement techniques. Second, obtaining brain MRI scans, necessary for assessing brain and thalamic volumes, may not be routinely available in spinal cord MRI protocols, and neurodegenerative diseases such as multiple sclerosis can influence brain measurements and potentially introduce bias during normalization.
1.3 Spinal cord template#
Similarly to brain studies, spinal cord studies involving multiple subjects frequently rely on templates — standardized, high-resolution images of the human spinal cord used as a reference for comparing and analyzing individual spinal cord scans. A commonly used spinal cord template is the PAM50 [De Leener et al., 2018]. The process of aligning individual single-subject images to the template typically involves a series of non-linear image transformations, which may introduce inaccuracies when computing morphometric measures in the PAM50 vs. in the native subject’s space. This is an important consideration, especially in subjects with altered spinal cord anatomy, such as patients with spinal cord injury.
1.4 Normative values#
Several multi-subject studies have provided normative values for spinal cord morphometry [De Leener et al., 2018, Frostell et al., 2016, Horáková et al., 2022, Kato et al., 2012, Taso et al., 2016]. However, these studies show inconsistency in their reporting. Some authors only provided values for intervertebral discs [De Leener et al., 2018, Horáková et al., 2022], while others presented values averaged across multiple vertebral levels [Taso et al., 2016]. Notably, none of these studies have presented normative values separated by sex.
1.5 Study Objective#
In this study, we present a database of healthy normative values for six commonly used measures of spinal cord morphometry built using a new fully-automatic normalization approach. The database is interactive, available online and allows filtering by sex, age, and MRI vendors. The proposed methodology is open-source, easily accessible through the Spinal Cord Toolbox (SCT) [De Leener et al., 2017], and can be used in future multi-subject studies to minimize inter- and intra-subject variability.
2. MATERIALS AND METHODS#
2.1 Participants#
We used data from the spine-generic multi-subject dataset [Cohen-Adad et al., 2021]. The dataset is open-access, organized according to the Brain Imaging Data Structure (BIDS) standard [Gorgolewski et al., 2016, Karakuzu et al., 2022] and managed using git-annex in this GitHub repository.
Participants were scanned across 43 centers on 3T MRI scanners from 3 vendors (GE, Philips and Siemens) using the consensus spine-generic acquisition protocol [Cohen-Adad et al., 2021]. For details on sequence parameters, see Cohen-Adad et al. [2021], Cohen-Adad et al. [2021].
Two experienced radiologists (MK, TR) evaluated MRI scans with a focus on the presence of spinal cord compression. Spinal cord compression was defined as a change in spinal cord contour at the level of an intervertebral disc on an axial or sagittal MRI plane compared with that at the midpoint level of neighbouring vertebrae [Kadanka et al., 2017, Keřkovský et al., 2017]. Minor abnormalities such as mild disc protrusions, spine misalignment or minimal widening of the spinal cord central canal were not considered significant pathologies.
Qualitative assessment of the spine-generic dataset by two experienced radiologists revealed mostly mild spinal cord compression in 64 out of the total 267 volunteers (see the “pathology” column in this spreadsheet). Those volunteers were excluded from the further analysis. The final cohort used for the normative database construction consisted of 203 healthy subjects (105 males and 98 females). Detailed demographic characteristics are provided in Table 1.
import os
from IPython.display import display, HTML
from plotly.offline import plot
cwd = os.getcwd()
os.chdir('analysis/notebooks')
from tables import table_demographic_characteristics
os.chdir(cwd)
# Define path to the CSV file
path_csv = '../data/PAM50-normalized-metrics-neurolibre/PAM50-normalized-metrics-neurolibre/table_1-demographic_characteristics.csv'
# Render plotly output in Jupyter Book
table1 = table_demographic_characteristics(path_csv, output='html')
plot(table1, filename = 'table1.html')
display(HTML('table1.html'))
TABLE 1 The demographic characteristics of subjects included in the normative database. The values are shown as mean and standard deviation.
2.2 Data pre-processing#
We used the T2-weighted images (0.8 mm isotropic resolution) covering at least C1 to T1 vertebral levels. The image processing was performed automatically using SCT v6.0 [De Leener et al., 2017]. For each participant, the spinal cord was segmented using a deep learning-based algorithm [Gros et al., 2019] and the intervertebral discs were labeled [Ullmann et al., 2014] to generate the cord segmentation labeled with vertebral levels (Figure 1A).
The spinal cord segmentation and disc labels were visually inspected using SCT’s quality control report (sct_qc function) and manually corrected when necessary. The manual corrections ensured that the spinal cord segmentation masks used for the computation of morphometric measures were reliable. Segmentation masks were corrected using FSLeyes image viewer [McCarthy, 2022] by adding or removing voxels when appropriate. Regarding vertebral labeling corrections, we manually identified the posterior tip of the intervertebral discs using SCT’s sct_label_utils function when it was necessary.
2.3 Normalization#
Figure 1 shows a schematic representation of the fully-automatic normalization approach based on linear interpolation of morphometric measures from the subject’s native space to the anatomical dimensions of the PAM50 spinal cord template [De Leener et al., 2018].
After the preprocessing (i.e., spinal cord segmentation and labeling), the morphometric measures were computed across individual axial slices from the spinal cord segmentation mask in the subject’s native space. Then, the number of axial slices corresponding to each vertebral level was identified in both the subject’s native space and in the PAM50 template based on the labeled segmentation. Finally, the computed morphometric measures were linearly interpolated to the PAM50 anatomical dimensions based on the number of slices for each vertebral level in the native space and the PAM50 template.
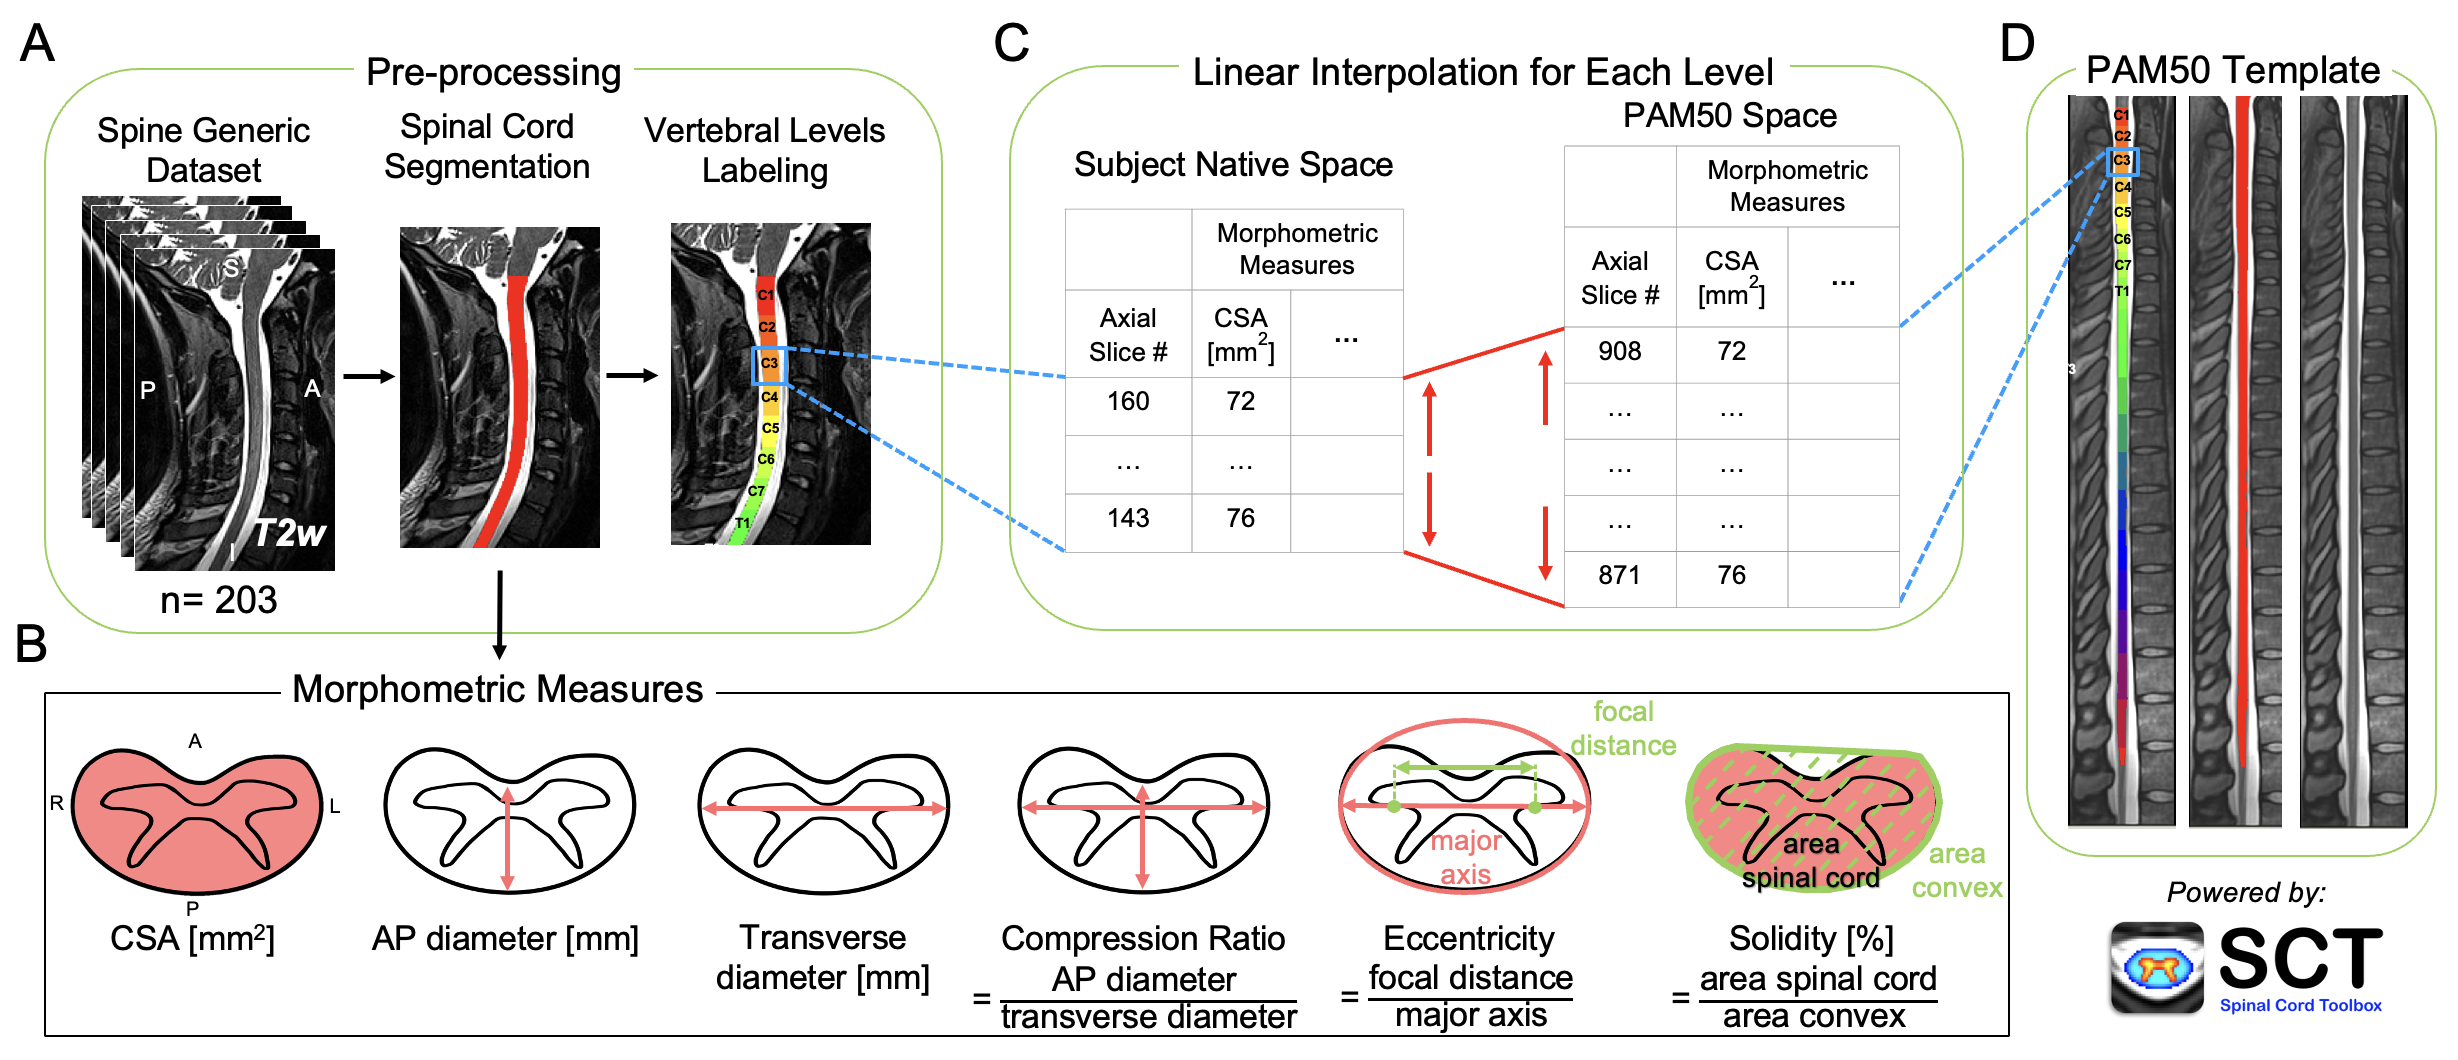
FIGURE 1 Schematic representation of the normalization approach. (A) T2-weighted images of 203 participants from the spine-generic dataset (multi-subject) were used. The spinal cord was segmented, and vertebral levels were identified automatically using the Spinal Cord Toolbox (SCT). (B) Six morphometric measures were computed for each axial slice from the single-subject segmentation masks. (C) For each vertebral level, the number of slices in the subject native space and the corresponding vertebral level in the PAM50 template (D) were identified. Then, the morphometric measures were linearly interpolated to the PAM50 space using the number of slices in the PAM50 template and the subject native space for each vertebral level.
The following morphometric measures were computed using SCT’s sct_process_segmentation for each participant: cross-sectional area (CSA), anteroposterior (AP) diameter, transverse diameter, compression ratio, eccentricity, and solidity.
Spinal cord CSA reflects the atrophy of the spinal cord and is computed as the area of the spinal cord in the transverse plane. The AP diameter is the measurement of the diameter of the spinal cord in the anterior-posterior direction, while the transverse diameter is the measurement of the diameter of the spinal cord from side to side. The compression ratio reflects the flattening of the spinal cord and is defined as the ratio of the AP diameter and the transverse diameter. Eccentricity is defined as the ratio of the focal distance over the major axis length of an ellipse with the same second moments as the spinal cord. The value is in the interval [0, 1]. When it is 0, the ellipse becomes a circle. Solidity is used to measure the indentation of the spinal cord and is defined as the ratio of the area representing the spinal cord to the area of the smallest convex polygon surrounding all positive pixels in the image. Solidity is relevant in detecting non-convex shapes, for instance, in subjects with spinal cord compression.
2.4 Normative values and interactive database#
Morphometric measures normalized to the PAM50 space were used for the calculation of normative values of the spinal cord morphometry. The normative values were calculated as mean and standard deviation across participants for slices in PAM50 space corresponding to each intervertebral disc and the middle of each vertebral level. The normative values are provided for the whole cohort and separated by sex.
For convenient introspection of the morphometric measures, interactive figures were created using the Plotly Python library v5.9.0. The figures allow interactive visualization of normative values for any slice in the PAM50 space and filtering for sex, age decades, and MRI vendors. The figures show values per slice (instead of per vertebral level), to prevent the loss of information that would arise if values were averaged within each vertebral level.
2.5 Statistical analysis#
Statistical analysis was conducted using the SciPy Python library v1.10.1 [Virtanen et al., 2020]. Descriptive statistics, including mean and standard deviation, were computed for age, height, and weight. The Shapiro-Wilk normality test was used to assess data normality. Differences between males and females in age, height, and weight were examined using the Wilcoxon rank-sum test. Morphometric measures in PAM50 space were averaged across participants for each slice and compared between sex and MRI vendors using the Wilcoxon rank-sum test. The significance level was set to alpha = 0.001.
The inter-subject coefficient of variation (COV), defined as the ratio of standard deviation and mean, was computed per slice for all morphometrics measures. The COV was then averaged for individual vertebral levels. Additionally, the mean COV for the whole cervical spinal cord was computed as average across all slices.
3. RESULTS#
3.1 Morphometric measures - Variation across vertebral levels#
Figure 2 shows morphometric measures plotted across individual slices with vertebral levels identified on the plot. Values were calculated as mean and standard deviation across 203 participants for each slice in the PAM50 space.
import os
from IPython.display import display, HTML
from plotly.offline import plot
cwd = os.getcwd()
os.chdir('analysis/notebooks')
from utils import read_metrics, create_subplot
os.chdir(cwd)
# Define path to the CSV file
path_csv = '../data/PAM50-normalized-metrics-neurolibre/PAM50-normalized-metrics-neurolibre/spine-generic_subjects_aggregated_metrics.csv'
# Read the CSV file
df = read_metrics(path_csv)
# Render plotly output in Jupyter Book
figure2 = create_subplot(df, output='html')
plot(figure2, filename = 'figure2.html')
display(HTML('figure2.html'))
FIGURE 2 Spinal cord morphometric measures of 203 healthy participants across slices from C1 to T1 vertebral level.
Figure 3 shows a scatter plot for COV for each morphometric measure plotted across individual slices with vertebral levels identified on the plot. The figure also shows the mean COV for each vertebral level and the mean and standard deviation COV averaged across all slices. CSA demonstrated the highest mean COV of 11.7 ± 1.4%; on the other hand, solidity presented the lowest mean COV of 1.2 ± 0.2%.
import os
from IPython.display import display, HTML
from plotly.offline import plot
cwd = os.getcwd()
os.chdir('analysis/notebooks')
from utils import read_metrics, create_regplot
os.chdir(cwd)
# Define path to the CSV file
path_csv = '../data/PAM50-normalized-metrics-neurolibre/PAM50-normalized-metrics-neurolibre/spine-generic_subjects_aggregated_metrics.csv'
# Read the CSV file
df = read_metrics(path_csv)
# Render plotly output in Jupyter Book
figure3 = create_regplot(df, show_cv=True, output='html')
plot(figure3, filename = 'figure3.html')
display(HTML('figure3.html'))
FIGURE 3 Coefficient of variation (COV) for individual morphometrics measures of 203 healthy participants across slices from C1 to T1 vertebral level. The mean COV for each vertebral level and the mean and standard deviation COV averaged across all slices are also shown.
3.2 Morphometric measures - Influence of sex#
Figure 4 presents morphometric measures plotted across individual slices with vertebral levels identified on the plot separated per sex (males: N = 105, females: N = 98). Values were calculated as mean and standard deviation across 203 participants for each slice in PAM50 space. Wilcoxon rank-sum test showed significant differences (p < .001) between males and females for CSA, AP diameter and transverse diameter.
import os
from IPython.display import display, HTML
from plotly.offline import plot
cwd = os.getcwd()
os.chdir('analysis/notebooks')
from utils import read_metrics, create_subplot_hue
os.chdir(cwd)
# Define path to the CSV file
path_csv = '../data/PAM50-normalized-metrics-neurolibre/PAM50-normalized-metrics-neurolibre/spine-generic_subjects_aggregated_metrics.csv'
# Read the CSV file
df = read_metrics(path_csv)
# Render plotly output in Jupyter Book
figure4 = create_subplot_hue(df, hue='sex', output='html')
plot(figure4, filename = 'figure4.html')
display(HTML('figure4.html'))
FIGURE 4 Spinal cord morphometrics measures of 203 healthy participants separated per sex (males: N = 105, females: N = 98) across slices from C1 to T1 vertebral level. You can show or hide traces by clicking on their corresponding legend items.
3.3 Morphometric measures - Influence of MRI vendor#
Figure 5 shows morphometric measures plotted across individual slices with vertebral levels identified on the plot separated for three MRI vendors (GE: N = 28, Philips: N = 36, Siemens: N = 139). Values were calculated as mean and standard deviation across 203 participants for each slice in the PAM50 space. Wilcoxon rank-sum test showed significant differences (p < .001) for the following comparisons: Siemens vs. Philips and Siemens vs. GE for CSA and AP diameter, Siemens vs. Philips for transverse diameter, and Siemens vs. Philips and Philips vs. GE for compression ratio, eccentricity and solidity.
import os
from IPython.display import display, HTML
from plotly.offline import plot
cwd = os.getcwd()
os.chdir('analysis/notebooks')
from utils import read_metrics, create_subplot_hue
os.chdir(cwd)
# Define path to the CSV file
path_csv = '../data/PAM50-normalized-metrics-neurolibre/PAM50-normalized-metrics-neurolibre/spine-generic_subjects_aggregated_metrics.csv'
# Read the CSV file
df = read_metrics(path_csv)
# Render plotly output in Jupyter Book
figure5 = create_subplot_hue(df, hue='vendor', output='html')
plot(figure5, filename = 'figure5.html')
display(HTML('figure5.html'))