Abstract
Optical coherence tomography (OCT) robustly measures retinal ganglion cell (RGC) integrity. However, OCT cannot assess the integrity of RGC axons past the optic nerve head. Here we used MP2RAGE-derived T mapping to quantify the first 15 mm of the intraorbital optic nerve, and related it to OCT-derived retinal thickness in fourteen adults. T varied smoothly along the nerve, decreasing from anterior to posterior locations. Greater retinal thickness was associated with shorter optic nerve T, with the 1-3 mm parafoveal RGC complex exhibiting the strongest correlation (R² = 0.84) and the global peripapillary RNFL exhibiting the weakest (R² = 0.75). These results are consistent with coupled variation in retinal axonal architecture and optic nerve myelin-related tissue content. An interactive dashboard was created so results can be explored along the entire optic nerve segment and when including or excluding participants clinically diagnosed with retinal disorders. Our findings suggest that OCT-based layer thickness and MRI-based T relaxation time are complementary measures of RGC integrity.
Introduction
The optic nerve plays a central role in visual processing by transmitting neural signals from retinal ganglion cells to the lateral geniculate nucleus and onward to the visual cortex. Efficient conduction along this pathway requires densely packed, highly organized, and heavily myelinated axons 1. Owing to its small diameter, high myelin content, and functional specialization, the optic nerve represents a compelling model for studying the impact of white-matter integrity in vivo 2.
Conventional clinical assessment of optic nerve integrity relies on fundus imaging and, increasingly, optical coherence tomography (OCT) 3. OCT enables quantitative measurement of retinal ganglion cell (RGC) layer thickness in the macula, and retinal nerve fiber layer (RNFL) thickness in the optic disc. These measurements have been established as surrogate biomarkers of retinal ganglion cell count and integrity 4563. However, retinal ganglion cell axons are unmyelinated within the eye and only become myelinated posterior to the lamina cribrosa 7. Since OCT measurements are limited to the retina and optic nerve head, OCT can provide information about retinal axonal structure, but not about myelin within the intraorbital optic nerve. Ideally, biomarkers of optic nerve integrity capture both axonal and myelin content, as each contributes to visual function and may be differentially affected across neurological and ophthalmic diseases.
Among OCT-derived measurements, the macular ganglion cell complex (GCC) within the central 1-3 mm annulus and the global peripapillary retinal nerve fiber layer (RNFL) average are of particular interest. Histological studies have shown that retinal ganglion cell axon density peaks near 1 mm from the foveal center and remains highest within the parafoveal region, making GCC 1-3 mm a sensitive marker of ganglion cell integrity 8. The global RNFL average complements this measure by capturing the thickness of axons from the entire retina as they converge to form the optic nerve, providing a representative measure of overall retinal axonal content.
In contrast, magnetic resonance imaging (MRI) can assess the optic nerve along its entire length and is used routinely in clinical practice to detect gross structural abnormalities, including inflammation, atrophy, and focal lesions 9210. However, standard T- and T2-weighted sequences remain largely qualitative and lack sensitivity to subtle microstructural variation, such as altered myelin content in the absence of clinically overt signal abnormalities 11.
Assessing microstructural variation within the optic nerve is further complicated by the nerve’s small diameter, curved trajectory, and passage through anatomically distinct environments along its length. The nerve traverses orbital fat within the intraorbital segment, bone within the optic canal, and brain parenchyma intracranially 12. This adjacent orbital fat further generates a chemical-shift artifact at the fat-nerve interface that displaces signal and blurs the nerve boundary 1314. In addition, the transition between these distinct anatomical environments, particularly near the paranasal sinuses, introduces susceptibility-related distortion that complicates segmentation and limits comparability of measurements across segments 1514. Involuntary eye movements further contribute motion artifacts. Beyond these sources of image degradation, cerebrospinal fluid (CSF) within the optic nerve sheath constitutes an immediately adjacent long-T, high-signal compartment that, at typical clinical resolutions, produces substantial partial-volume contamination and can inflate and bias quantitative estimates 1614. Together, these factors limit the robustness and reproducibility of quantitative MRI techniques applied to the optic nerve.
To address these limitations, a range of quantitative MRI techniques has been explored to probe optic nerve microstructure in vivo. Diffusion-weighted imaging has been the most widely applied approach, offering indirect sensitivity to axonal organization and demyelination through metrics such as fractional anisotropy and diffusivity 171819202122. Other approaches, including magnetization transfer imaging 2324, myelin water imaging 25, and T2 relaxometry 2, have also been investigated to improve sensitivity to macromolecular and myelin-related tissue properties. Each of these techniques, however, is compromised to varying degrees by the anatomical constraints described above, and none has been established as a robust, routine measure of optic nerve microstructure.
T relaxometry offers a quantitative approach for probing optic nerve microstructure by providing voxelwise measurements of intrinsic tissue properties that are less dependent on scanner-specific image contrast than conventional weighted MRI 26. T can be quantified using MP2RAGE, (Magnetization Prepared 2 Rapid Acquisition Gradient Echoes), which provides accurate T estimates while reducing sensitivity to B1 inhomogeneity and receive-coil bias 27. These properties make MP2RAGE particularly well suited for imaging anatomically challenging structures such as the intraorbital optic nerve. In healthy adult white matter at 3T, MP2RAGE-derived T values are approximately 810 ± 30 ms, providing a general reference for interpreting MP2RAGE-derived optic nerve measurements, while acknowledging the previously described factors that limit measurement accuracy and comparability in this structure 27.
Quantitative T 2829 has been widely investigated as a surrogate marker of myelin content, with systematic reviews and meta-analyses identifying T among the MRI metrics that consistently correlate with myelin across experimental models and imaging studies 3031. This interpretation is also supported by the macromolecular tissue volume (MTV) framework proposed by Mezer et. al., which demonstrated that longitudinal relaxation rate (R1 = 1/T₁) scales with the non-water fraction of a voxel 32. In white matter, this macromolecular compartment is dominated by myelin, which constitutes approximately 50-60% of the tissue dry weight and represents the largest single macromolecular component 3334. Consistent with this relationship between myelin content and T relaxation, demyelinating white matter lesions in multiple sclerosis exhibit prolonged quantitative T values, supporting the use of T as a practical proxy marker of myelin integrity 353637.
Despite these advances, few studies have directly related OCT-derived measures of retinal structure to quantitative MRI markers of optic nerve microstructure, and in vivo validation of any candidate MRI myelin marker against an independent structural measure remains scarce 2523382422. Here, we used MP2RAGE-derived T mapping to quantify the intraorbital optic nerve and examined its relationship with OCT-derived retinal thickness measurements in the macula and around the optic disc. We hypothesized that intraorbital optic nerve T would show region-specific associations with OCT measurements, supporting the biological coupling between retinal axonal architecture and optic nerve microstructure.
Results
MP2RAGE-derived T values were successfully quantified along the first 15 mm of the intraorbital optic nerve in all participants. T measurements were extracted using a skeleton-based segmentation, in which a single voxel located at the center of the optic nerve was sampled on each coronal slice, as illustrated in Figure 5. Visual inspection of the resulting longitudinal profiles within the interactive dashboard demonstrated smooth T variation along the nerve, without abrupt transitions or discontinuities (Figure 2). Mean T values progressively decreased from the anterior (0-5 mm, 1005 ± 150 ms) to the middle (5-10 mm, 874 ± 136 ms) and posterior (10-15 mm, 855 ± 120 ms) segments, yielding an overall mean T of 911 ± 128 ms across the full 0-15 mm intraorbital segment. Left and right optic nerves exhibited visually similar profiles. The accompanying interactive dashboard allows individual participants to be included or excluded, enabling visual assessment of the influence of each subject on the T profiles and subsequent OCT-T associations.
How to enable interactive figures?

Figure 1:Instructions to establish a live communication between the preprint and dashboard.

Figure 2:T as a function of position along the optic nerve. Slice-wise mean T values along the first 15 mm of the intraorbital optic nerve for left (filled blue) and right (open green) eyes demonstrate smooth spatial variation without abrupt transitions across the intraorbital segment. Error bars indicate the ±1 between-participant standard deviation. Data can be explored in further detail by following the instructions presented in Figure 1.
To quantify these observations, a linear mixed-effects model was fitted with position, side, and their interaction as fixed effects and subject as a random intercept. T decreased significantly with increasing distance from the optic disc ( = -14 ms/mm, p < 0.001). Neither the effect of side ( = 3 ms, p = 0.88) nor the side-by-position interaction (p = 0.60) reached statistical significance, indicating comparable longitudinal T profiles in both optic nerves.
We next examined the relationship between intraorbital optic nerve T and OCT-derived retinal thickness measurements. We extracted two primary OCT-based measures: average ganglion cell complex (GCC) thickness in the central 1-3 mm of the macula, and average RNFL thickness in the central 2.5-4.5 mm of the optic disc. We focused on the GCC and RNFL averages because they provide good summary measures of the macular ganglion cell complex and the peripapillary retinal nerve fiber layer, respectively. Because left and right optic nerves showed comparable T profiles, with no significant effect of side, measurements from the two eyes were averaged within each participant, and associations were assessed at the participant level using ordinary least-squares regression. Each point in Figure 3 therefore represents one participant. All reported associations were significant following FDR correction. In the dashboard, these regression panels can be updated interactively by selecting OCT sectors, T segments, or displayed statistics. The associations can additionally be examined with a linear mixed-effects model treating individual eyes as repeated measures within participants.

Figure 3:Association between retinal thickness and intraorbital optic nerve T for the primary OCT summary measures. Left: macular ganglion cell complex (GCC) All average (1-3 mm annulus). Right: global peripapillary retinal nerve fiber layer (RNFL) average. Each point represents one participant, with T and retinal thickness averaged across both eyes; lines indicate the ordinary least-squares fit. In the interactive figure, individual participants can be clicked to exclude them from the regression, allowing the influence of each observation on the fit to be assessed directly. Instructions to enable interactive reading are presented in Figure 1. For further exploration, including alternative OCT sectors, T segments, and a linear mixed-effects analysis treating eyes as repeated measures, please see the interactive dashboard.
For the GCC (1-3 mm) average, greater retinal thickness was associated with lower optic nerve T across the full 0-15 mm intraorbital segment (R² = 0.84, pFDR < 0.05). A similar negative relationship was observed for the global RNFL average, although the association was weaker than for the macular GCC measurement (R² = 0.75, pFDR < 0.05).
To determine whether these relationships depended on the location along the optic nerve, analyses were repeated for the anterior (0-5 mm), middle (5-10 mm), and posterior (10-15 mm) segments. The GCC (1-3 mm) average exhibited significant negative associations in the anterior (0-5 mm: R² = 0.68, pFDR < 0.05), middle (5-10 mm: R² = 0.78, pFDR < 0.05), and posterior (10-15 mm: R² = 0.88, pFDR < 0.05) segments. The global RNFL average showed a similar pattern, with significant negative associations in the anterior (R² = 0.55, pFDR < 0.05), middle (R² = 0.69, pFDR < 0.05), and posterior (R² = 0.82, pFDR < 0.05) segments.
For both GCC (1-3 mm) and RNFL average, the proportion of explained variance increased toward the posterior optic nerve, while regression slopes remained comparable across segments, with overlapping 95% confidence intervals. Together, these findings indicate that the relationship between retinal thickness and optic nerve T is present throughout the first 15 mm of the intraorbital optic nerve and is consistently stronger for macular GCC than for global RNFL measurements.
Although the GCC (1-3 mm) average and RNFL average provided the strongest overall associations, these summary measures do not indicate whether the relationship is uniformly distributed across the retina. We therefore examined the association between optic nerve T and each individual retinal sector.
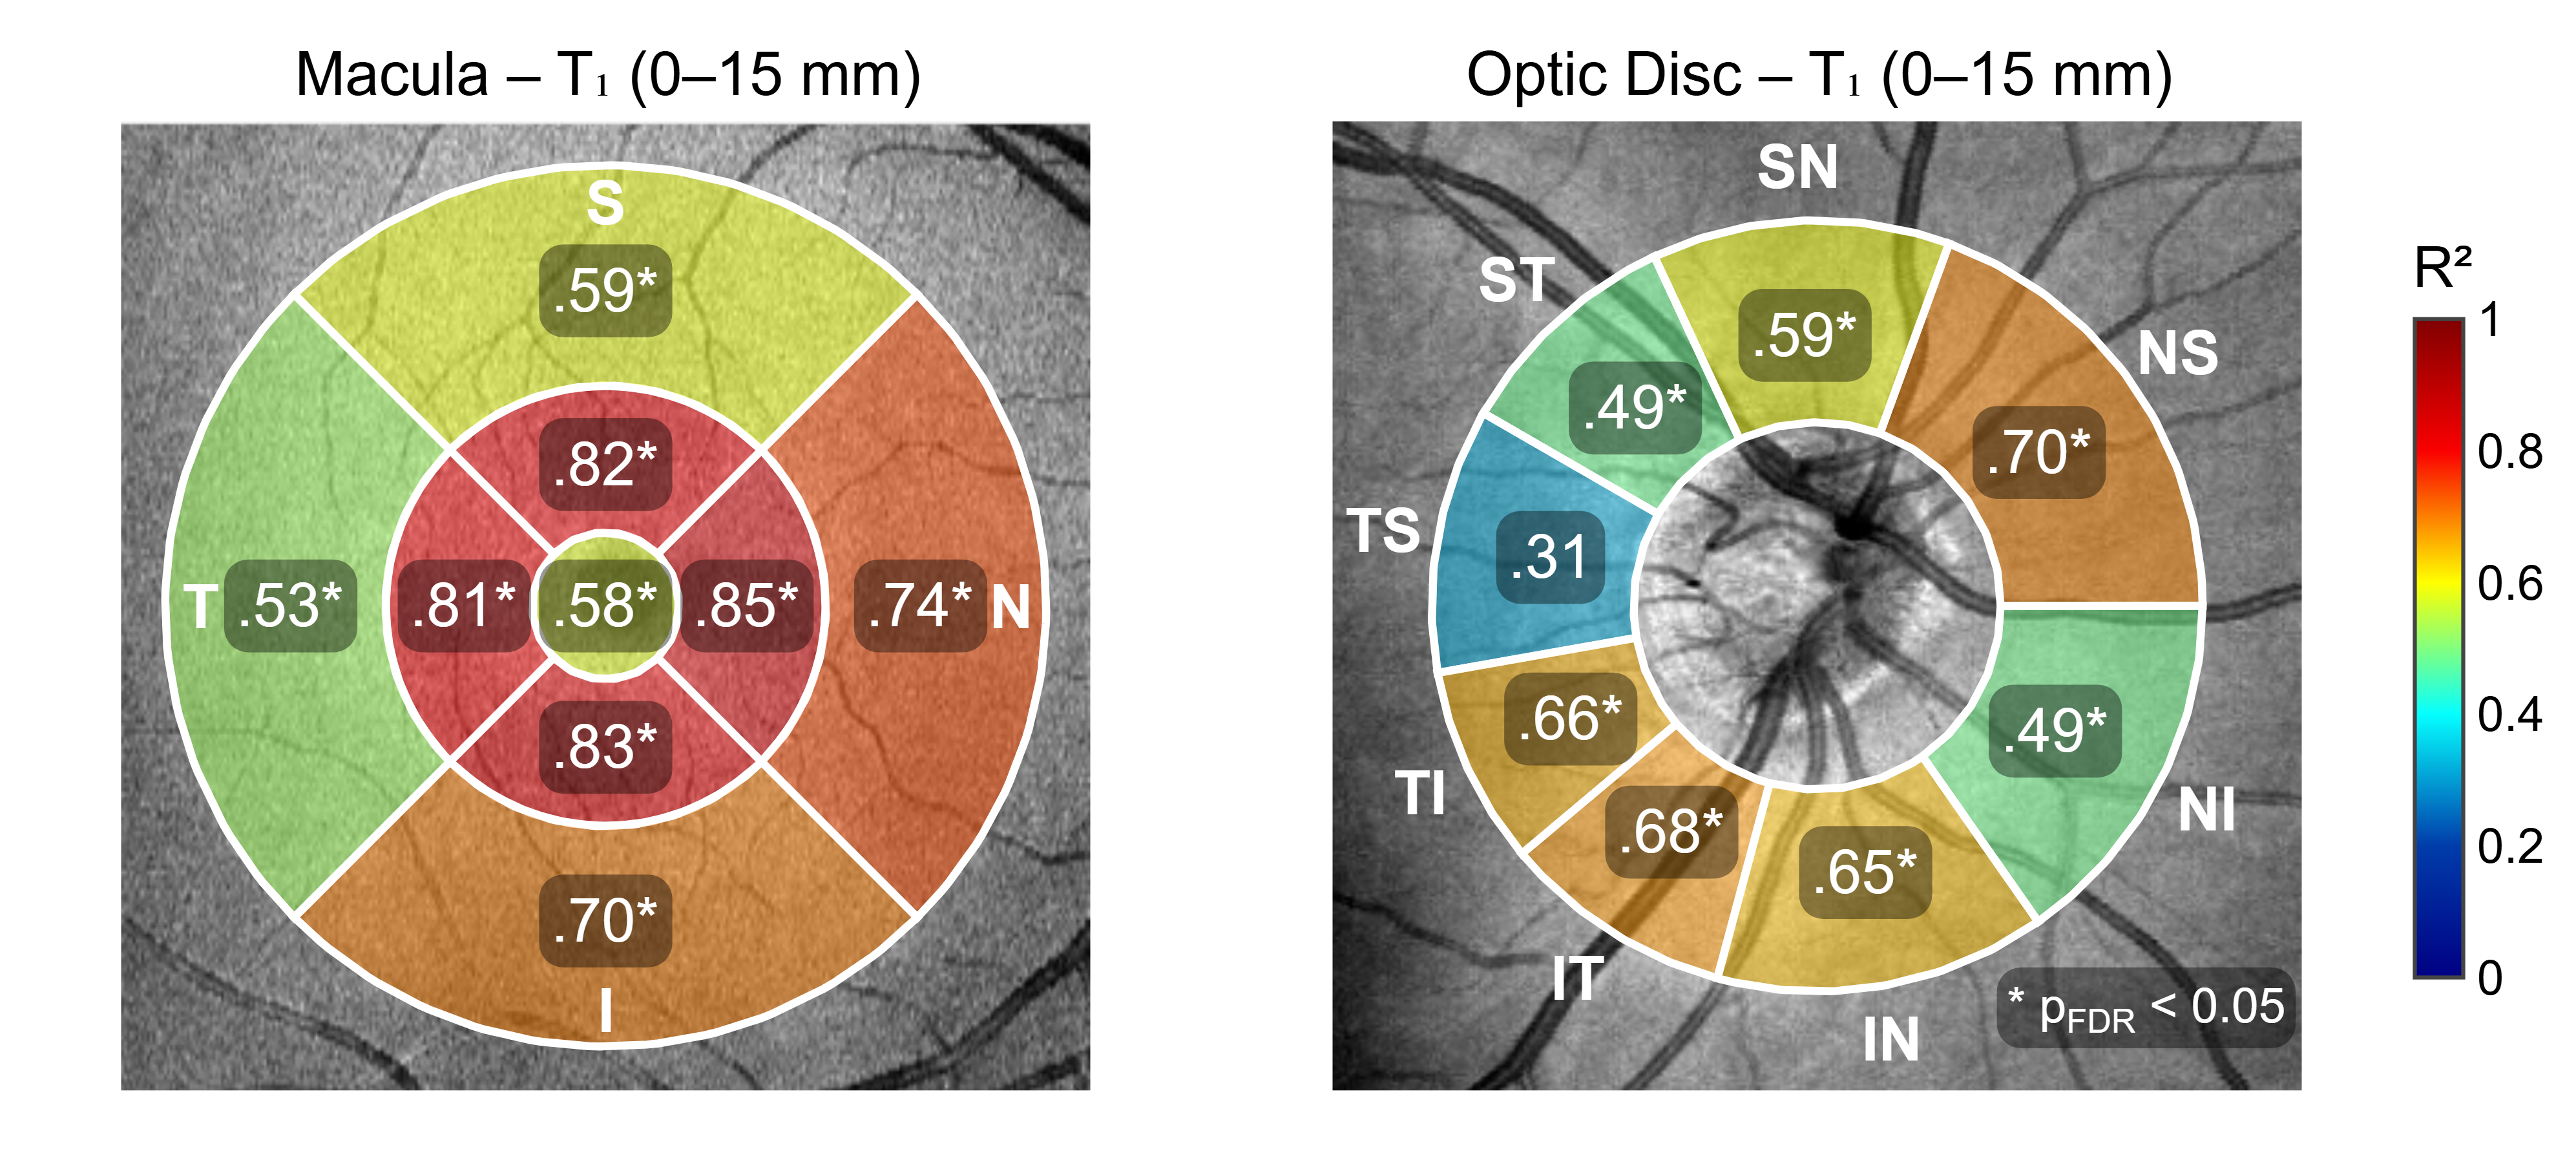
Figure 4:Coupling between MRI- and OCT-based metrics. Sector-wise results relating mean intraorbital optic nerve T to retinal thickness measured by OCT. Left: macular ganglion cell complex (GCC) sectors. Right: optic disc retinal nerve fiber layer (RNFL) sectors. Color intensity reflects the strength of association (R), and inset values indicate FDR-corrected p-values. Stronger associations were observed in central and nasal macular sectors, while several superior-nasal and inferior-temporal RNFL sectors demonstrated significant relationships. All significant associations were negative, indicating shorter T values (i.e., increased myelin content) in eyes with greater retinal thickness. Data can be explored in further detail by following the instructions presented in Figure 1.
Within the macula, the GCC 1-3 mm annulus exhibited strong association with optic nerve T (R² = 0.81-0.85, pFDR < 0.05). Among the individual sectors, the strongest association was observed in the nasal sector of the 1-3 mm annulus (R² = 0.85, pFDR < 0.05). Significant negative associations were also observed in the central 1 mm region (R² = 0.58, pFDR < 0.05) and in the superior, inferior, nasal, and temporal sectors of the outer 3-6 mm annulus (R² = 0.53-0.74, pFDR < 0.05). Overall, the spatial distribution of association strengths demonstrated a clear regional pattern, with the strongest relationships localized to the parafoveal GCC, particularly within the nasal 1-3 mm annulus.
For peripapillary RNFL measurements, the global average thickness demonstrated a significant association with intraorbital optic nerve T (R² = 0.75, pFDR < 0.05). Among the individual Garway-Heath sectors, the inferior-temporal, temporal-inferior, and nasal-superior regions exhibited the strongest associations (R² = 0.68-.70, pFDR < 0.05), while all significant relationships remained negative. Overall, sector-wise associations were consistently stronger in the macula than around the optic disc.
Finally, we examined whether the GCC (1-3 mm) association was influenced by individual participants. Influence was assessed in two ways: at the participant level, on the subject-mean regressions used throughout, and at the eye level, using a linear mixed-effects model with participant as a random intercept and standardized residuals for linear mixed models 39. Both analyses were repeated for the anterior (0-5 mm), middle (5-10 mm), posterior (10-15 mm), and full (0-15 mm) T segments. Model assumptions were satisfied in the mixed-effects analysis (Shapiro-Wilk on least-confounded residuals, p = 0.99), and between-participant variance accounted for the majority of total variance in most segments (ICC 0.39-0.67), supporting the decision to average eyes within participants for the primary analysis. Across both methods and all four segments, only two participants were flagged by any criterion, and for distinct reasons: one deviated from the fitted relationship, while the other exerted disproportionate weight on it without deviating from it.
Participant sub-0610, shown in the final column of Figure 5, was clinically classified as healthy at the time of imaging, but showed greater optic nerve T than predicted from retinal thickness. In the eye-averaged analysis, this participant was identified as both an outlier and an influential observation for the 0-15 mm segment (studentized residual = 3.1, Cook's distance = 0.33). The same participant, specifically the right eye, was the only observation flagged in the eye-level mixed-effects analysis (standardized residual = 2.5). The deviation was concentrated in the anterior optic nerve: it was largest in the 0-5 mm segment in both analyses (studentized residual = 3.7; standardized residual = 3.8) and was absent in the middle and posterior segments. Retinal thickness in this participant did not differ appreciably from the cohort distribution, indicating that the deviation originated from elevated T rather than from abnormal retinal thickness. Excluding this participant, the 0-15 mm association remained negative and significant in the GCC (1-3 mm) sector (R² = 0.92).
Participant sub-0480, shown in the penultimate column of Figure 5, was clinically classified as visually impaired, and diagnosed with atrophy of both optic nerves. This participant had markedly thinner GCC (57 µm, compared with approximately 100-118 µm in the remainder of the cohort) together with correspondingly high optic nerve T (1283 ms), and was therefore positioned far along the retinal thickness axis, giving high leverage in every segment (0.77). However, the participant was never identified as an outlier (|studentized residual| ≤ 1.0 in all segments) and was not flagged in the eye-level mixed-effects analysis, indicating that measurements were consistent with the fitted relationship rather than deviating from it. Influence on the fit varied by segment: Cook’s distance exceeded the flagging threshold in the anterior (1.77) and full (0.50) segments but was negligible in the middle and posterior segments (≤ 0.01), where the observation fell almost exactly on the fitted line despite identical leverage. Because leverage of this magnitude can shape a regression in a modest sample, we repeated the 0-15 mm analysis excluding this participant (R² = 0.51) and excluding both flagged participants (R² = 0.72); the negative association persisted in both cases. This participant corresponds to the leftmost point in the GCC panel of Figure 3, and its effect on the fit can be examined directly in the interactive version by excluding it from the regression.
No other participant or eye was flagged as an outlier, an influential observation, or a high-leverage observation in any segment under either analysis. Together, these results indicate that the coupling between retinal thickness and optic nerve T is not attributable to individual observations, while identifying one participant whose anterior optic nerve T was elevated relative to retinal structure.
Discussion
In this study, we combined OCT- and MRI-based measurements to examine the relationship between retinal axonal structure and intraorbital optic nerve microstructure in vivo. Using MP2RAGE-derived T mapping and skeleton-based optic nerve sampling, we demonstrated that quantitative T can provide spatially coherent characterization of the first 15 mm of the intraorbital optic nerve. T values varied smoothly along the nerve without abrupt discontinuities, supporting the robustness of the sampling approach and suggesting that the measurements captured organized longitudinal variation rather than unstable segmentation or local image artifacts.
Across the 0-15 mm intraorbital segment, mean optic nerve T was 911 ± 128 ms, with values decreasing from the anterior to posterior segments. These values remain higher than typical cerebral white matter T values reported at 3T using MP2RAGE, which are approximately 810 ± 30 ms 27. The observed difference likely reflects intrinsic microstructural and environmental distinctions between the optic nerve and brain white matter, including differences in axonal packing density, myelin organization, extracellular water content, vascular environment, and the unique anatomical context of the nerve within the orbit 162. Partial-volume effects from surrounding cerebrospinal fluid within the optic nerve sheath and adjacent orbital fat may also contribute to elevated absolute values 161314. The use of a skeleton-based approach, in which a single central voxel was sampled along each coronal slice, was designed to minimize boundary contamination. The smoothness of the resulting longitudinal profiles further argues against dominant susceptibility-driven distortion or segmentation instability as the primary source of the observed measurements.
A notable feature of the T profiles was the significant anterior-to-posterior decrease in T. The anterior optic nerve is particularly vulnerable to partial-volume effects because of its proximity to the globe, optic nerve head, cerebrospinal fluid, and orbital fat. The higher anterior T values may therefore partly reflect greater sensitivity to adjacent long-T compartments. However, biological explanations are also plausible, including regional variation in axonal packing, myelin density, extracellular water fraction, or tissue organization along the intraorbital nerve. Importantly, left and right optic nerves showed comparable profiles, with no significant effect of side and no side-by-position interaction. This lack of left-right asymmetry supports the reproducibility of the measurement and suggests that the observed longitudinal gradient reflects a consistent anatomical or methodological feature rather than lateralized segmentation bias.
The central finding of this study is the strong negative association between intraorbital optic nerve T and OCT-derived retinal thickness measures. Greater retinal thickness was associated with shorter optic nerve T. Expressed in terms of relaxation rate, this means that R1, or 1/T, scales positively with OCT thickness. This direction is biologically meaningful. OCT-derived GCC and RNFL thickness reflect retinal ganglion cell bodies, dendrites, and axons, whereas optic nerve T is sensitive to myelin and macromolecular composition 4303256331. A thicker retinal ganglion cell complex or nerve fiber layer may indicate greater axonal content, which would be expected to scale with greater myelin-related macromolecular content in the post-laminar optic nerve. Because increased macromolecular and myelin content shortens T, the observed negative T-OCT relationship is consistent with coupled variation in retinal axonal architecture and optic nerve white-matter microstructure. Even though T cannot be interpreted as a direct measure of myelin 31, the observed pattern is consistent with its known sensitivity to macromolecular tissue composition 3032.
The strongest associations were observed for macular GCC measurements, particularly within the 1-3 mm annulus. This region is biologically well suited to capture retinal ganglion cell integrity because ganglion cell density is highest in the parafoveal macula 8. The GCC 1-3 mm average showed the strongest overall association with intraorbital optic nerve T, and sector-wise analyses further indicated prominent associations in the nasal and superior parafoveal regions. This spatial pattern is anatomically plausible, as the nasal macula contributes substantially to the papillomacular bundle, which contains densely packed fibers projecting toward the optic disc 404142. These findings suggest that parafoveal GCC thickness may be particularly sensitive to inter-individual variation in the axonal substrate that gives rise to optic nerve microstructure.
Associations with global RNFL thickness were also significant but generally weaker than those observed for GCC. This difference may reflect both biological and methodological factors. RNFL thickness represents axons from the entire retina as they converge at the optic disc, whereas macular GCC measurements more directly sample the region of highest retinal ganglion cell density. In addition, peripapillary RNFL measurements are more susceptible to segmentation variability, vascular shadowing, and acquisition-related noise 4344. Participants may have greater difficulty maintaining eccentric fixation during optic disc imaging compared with central fixation during macular acquisition. Because the cohort was predominantly healthy and without acute optic nerve pathology, it is unlikely that RNFL measurements were substantially confounded by inflammatory swelling. The weaker RNFL associations therefore likely reflect a combination of lower regional specificity and greater measurement variability rather than absence of biological coupling.
Importantly, the T-OCT relationship was not confined to a single location along the optic nerve. Segment-wise analyses demonstrated significant negative associations in the anterior, middle, and posterior intraorbital segments. Although explained variance tended to be higher in more posterior segments, regression slopes were broadly comparable. This suggests that the biological relationship between retinal thickness and optic nerve T is distributed along the intraorbital nerve. The stronger posterior associations may reflect improved measurement precision, or more stable tissue boundaries rather than a fundamentally different biological relationship in posterior regions.
The outlier analyses provide further insight into the interpretation of the T-OCT relationship. One eye demonstrated greater-than-expected T relative to its OCT thickness and was identified as a residual outlier. This deviation was localized primarily to the anterior 0-5 mm segment, whereas the middle and posterior segments remained more consistent with the fitted relationship. Because OCT thickness in this eye was not significantly different from the cohort distribution, the elevated anterior T may represent a localized MRI abnormality, or subtle microstructural variation not captured by OCT. The absence of corresponding OCT thinning suggests that this observation should not be interpreted simply as reduced retinal axonal content. Instead, it highlights the possibility that quantitative MRI may detect localized optic nerve tissue variation that is not apparent on retinal imaging alone.
A second participant showed both lower-than-average GCC thickness and higher-than-average optic nerve T in both eyes. Unlike the residual T outlier, these eyes remained aligned with the fitted T-OCT relationship. This pattern suggests that the elevated T was proportional to reduced retinal thickness rather than representing an independent deviation. In this case, the combination of thinner GCC, higher T, and an apparently thinner optic nerve on visual inspection may reflect lower axonal content accompanied by lower myelin-related tissue content, rather than inflammation or focal edema. This interpretation remains cautious, because the present study was not designed to establish pathological status, but the observation is consistent with preserved coupling between retinal axonal measures and optic nerve microstructure.
Because one participant contributed relatively extreme OCT and T values, we performed sensitivity analyses to assess whether the main association was driven by a single observation. After excluding the participant with both low OCT thickness and high T, as well as the eye with a residual T outlier, the association in the strongest sector, GCC 1-3 mm remained present, with marginal R decreasing from approximately 0.84 to 0.72. This reduction indicates that the strength of the association was partly influenced by inter-individual variability at the extremes, as expected in a modest sample. However, the persistence of the relationship after exclusion supports the conclusion that the observed coupling is not solely driven by outliers. Rather, the data suggest a continuous relationship between retinal ganglion cell architecture and optic nerve T across the cohort.
We intentionally restricted the MRI analysis to the first 15 mm of the intraorbital optic nerve. This segment provided the most reliable anatomical definition and avoided the more challenging regions near the optic canal and intracranial optic nerve. As the nerve courses posteriorly, it transitions through environments with markedly different surrounding tissues, including orbital fat, bone, air-tissue interfaces, and brain parenchyma 1613. These transitions introduce susceptibility artifacts, reduced signal-to-noise ratio, and increased segmentation difficulty 14. In contrast, the intraorbital segment provides a more consistent anatomical target for quantitative imaging. The absence of significant left-right asymmetry within this segment further supports the decision to focus on this region. Nevertheless, future methodological advances may allow reliable extension of this approach into the canalicular and intracranial segments.
Segmentation remains an important methodological consideration. The skeleton-based strategy used here reduces partial-volume contamination by sampling the central portion of the optic nerve rather than averaging across the full cross-sectional area. This is particularly advantageous for a small structure surrounded by cerebrospinal fluid and orbital fat. However, manual identification or verification of the nerve trajectory remains time-intensive and may be subject to operator-dependent variability, especially in regions of reduced contrast 15. Recent advances in automated and deep learning-based optic nerve segmentation, including 3D U-Net and nnU-Net approaches, may improve reproducibility, reduce operator dependence, and facilitate application of quantitative optic nerve imaging in larger cohorts and multi-site studies 4546474815.
Several limitations merit attention. The sample size was modest (n = 15), and replication in larger cohorts will be necessary to confirm effect size stability. The age range of participants (19-69 years) was broad, and age-related changes in both T and retinal thickness were not explicitly modeled, which may influence the magnitude of observed associations 4950. Although the skeleton-based method reduces boundary contamination, it does not eliminate all partial-volume effects, motion sensitivity, susceptibility-related artifacts, or inter-individual variability in measurement precision 15. T is sensitive to multiple tissue properties, including myelin, water content, inflammation, axonal density, and macromolecular composition. Therefore, T should be interpreted as a non-specific but biologically informative marker of tissue microstructure rather than a direct measure of myelin. Finally, because the cohort was predominantly healthy, the present findings are likely to reflect physiological variation within a non-clinical range. The sensitivity of intraorbital T mapping to disease-related demyelination, edema, or axonal degeneration remains to be established.
The potential clinical relevance of this approach may be substantial. Disruption of optic nerve microstructure occurs in several neurological and ophthalmological diseases, including optic neuritis, multiple sclerosis, glaucoma, and other optic neuropathies. These conditions can involve demyelination, inflammatory edema, axonal degeneration, or combinations of these processes, ultimately affecting conduction velocity, temporal signal fidelity, and visual function 5152. OCT provides a robust measure of retinal ganglion cell and axonal integrity, but it does not directly assess the myelinated portion of the optic nerve. Quantitative MRI, by contrast, can probe tissue properties along the post-laminar optic nerve. Combining OCT and MRI may therefore provide complementary information about retinal axonal content and optic nerve myelin-related microstructure.
This combined approach may also be relevant in multiple sclerosis, where the optic nerve is frequently affected early in the disease course 53. Acute optic neuritis is often one of the first clinical manifestations of MS and is recognized as evidence of dissemination in space within the McDonald criteria 54. Even when visual acuity improves after acute inflammation, residual demyelination and axonal loss may persist and contribute to long-term disability 55. OCT measures have been related to MRI in multiple sclerosis across a large literature, recently synthesized in a meta-analysis of 68 studies and more than 6000 patients, in which the strongest pooled association was between peripapillary RNFL thickness and T lesion volume (r = -0.42) 38. These associations, however, relate retinal structure to global brain measures such as lesion burden and atrophy rather than to the optic nerve itself. Quantitative characterization of optic nerve tissue properties may therefore improve detection of subclinical or residual injury, support monitoring of disease evolution, and provide outcome measures for neuroprotective or remyelinating therapies 30.
Overall, these findings demonstrate that MP2RAGE-derived T mapping, combined with skeleton-based intraorbital optic nerve sampling, provides a stable and biologically coherent measure of optic nerve microstructure in vivo. The negative association between T and OCT-derived retinal thickness, particularly within the parafoveal GCC, supports a coupling between retinal axonal architecture and optic nerve tissue composition. The persistence of the main association after exclusion of outlying observations further supports the robustness of this relationship. Future studies should evaluate test-retest reproducibility, age effects, longitudinal sensitivity, and clinical applicability in demyelinating and neurodegenerative optic neuropathies, where combined MRI-OCT assessment may offer complementary insight into axonal and myelin-related injury.
Methods
Fifteen participants (n=15) were scanned on a 3T scanner (Siemens Prisma, Germany) with a 32-channel head coil. Written informed consent was obtained from all participants. Thirteen participants (9 female, 4 male, ages 19-43) had no history of neurological or ophthalmological disease. One participant (sub-0803, age 69, female) had moderate visual impairment associated with clinically diagnosed glaucoma caused by pseudoexfoliation syndrome. One participant (sub-0480, age 52, female) had severe visual impairment including color blindness, lack of stereoscopic depth perception, and best corrected visual acuity of 20/160 due to atrophy of both optic nerves without signs of mass or abnormal enhancement. As commonly seen in patients with unexplained optic nerve atrophy, the internal carotid arteries in close proximity to the optic nerves appeared slightly elongated (dolichoectatic) in this participant. For all participants, data from both eyes were analyzed.
Whole-brain MP2RAGE data were acquired with TR = 5000 ms, TI1/TI2 = 700/2500 ms, flip angles (FA) FA1/FA2 = 4°/5°, and 1 mm isotropic resolution. T maps were generated using the MP2RAGE module in qMRLab 5657, with fitting performed using the specified acquisition parameters.
The intraorbital optic nerves were segmented manually in native MP2RAGE T-map space with 3D Slicer 58. Left and right optic nerves were segmented independently by two trained raters (HAP, AQ) blinded to OCT measurements. Because the optic nerve is small and surrounded by cerebrospinal fluid and orbital tissue, T values were extracted using a centerline skeleton approach rather than a full-volume nerve mask. This approach was used to minimize partial-volume contamination from the optic nerve sheath and adjacent structures.
For each optic nerve, one central voxel was selected on each consecutive coronal slice across the first 15 slices of the intraorbital segment, yielding 15 skeleton voxels per nerve. The first voxel was selected near the optic disc as the first visually centered voxel within the optic nerve intensity profile, while avoiding voxels immediately adjacent to the vitreous or optic disc to reduce contamination from high-T structures. Subsequent voxels were selected on neighboring coronal slices by following the visually centered course of the optic nerve, using adjacent voxels to maintain a continuous centerline trajectory.
To visualize the skeleton extraction, an unfolded view of each optic nerve was generated. For each eye, the coronal line shown in Figure 5 corresponds to the axial index containing the segmented skeleton voxel. This representation displays the optic nerve as a continuous unfolded profile across the first 15 mm, allowing visual confirmation that the sampled voxels followed the center of the nerve.

Figure 5:Unfolded views of the intraorbital optic nerve for four participants (sub-0339, sub-0457, sub-0480, sub-0610). Top row: UNI images + T optic nerve segmentations illustrating skeleton-based voxel extraction. Bottom row: corresponding T maps.
Voxel-wise T values were extracted directly from the T map at each skeleton location. Because the MP2RAGE acquisition had 1 mm isotropic resolution, consecutive coronal slices were used as an approximate posterior position index over the first 15 mm of the intraorbital segment. Mean T values were computed for the full 0-15 mm segment and for three predefined subsegments: anterior 0-5 mm, middle 5-10 mm, and posterior 10-15 mm. Longitudinal T profiles were retained for visualization and for analysis of position-dependent variation.
OCT was performed in both eyes. Data were acquired using an Optovue Solix OCT (Visionix, USA). This high-speed spectral-domain OCT device utilizes a scanning laser to capture detailed cross-sectional images of the retina. Participants underwent two types of standard OCT scans. First, a macular scan was centered on the fovea to measure the thickness of the Ganglion Cell Complex (GCC), which includes the Retinal Nerve Fiber Layer (RNFL), Ganglion Cell Layer (GCL), and Inner Plexiform Layer (IPL). This scan provided thickness measurements across the 6.4x6.4 mm macula area. Second, a 6x6 mm scan centered on the optic disc was used to measure the thickness of the peripapillary retinal nerve fiber layer (RNFL), consisting of the retinal ganglion cell axons exiting the retina and entering the optic nerve.
All scans were automatically segmented with the Visionix Solix software. For the GCC thickness analysis, data were extracted for the full macula area and for specific sectors defined by the ETDRS (Early Treatment Diabetic Retinopathy Study) grid. The ETDRS grid 59 is a standard, 9-region macular map centered on the fovea, which divides the macula into three concentric rings (1 mm, 3 mm, and 6 mm in diameter) and four quadrants (superior, inferior, nasal, temporal), see Figure 4, left. For RNFL thickness analysis, data were extracted for the average peripapillary RNFL thickness and for each of the eight sectors of the modified Garway-Heath sector grid 60 in a 2.5-4.5 mm diameter concentric ring, see Figure 4, right. The signal strength index (SSI) for each scan was recorded as a measure of scan quality.
The following steps were taken for quality control and analysis of the OCT data for both eyes. All data were visually inspected by two trained raters (NB, AA). Data with a device-reported SSI < 60, with obvious motion artifacts, a field of view that did not fully cover the macula or optic disc, or diagnosable retinal integrity issues (n = 0 for macula, and n = 3 for optic disc) were excluded from further analysis. The automatic segmentation of the image volumes was then reviewed and manually refined in case of obvious segmentation errors (n = 0 for macula, n = 1 for optic disc). Of the 14 participants for which OCT data was acquired we thus retained n = 14 for macula analysis and n = 11 for optic disc-based analysis. The difference in retention rate is believed to be due to participants’ difficulty maintaining eccentric fixation during optic disc data acquisition, compared to central fixation during macula data acquisition.
Associations between OCT-derived thickness metrics and mean intraorbital T relaxation times were assessed in Python. Because left and right optic nerves showed comparable T profiles, with no significant effect of side, the primary analyses were conducted at the participant level: T and OCT measurements were averaged across both eyes within each participant, and associations were fitted by ordinary least squares (OLS) of the form:
where T1 is the eye-averaged mean T for participant j, X is the eye-averaged OCT metric, 0 and 1 are the intercept and slope, and is the residual error. Averaging within participants avoids treating the two strongly correlated eyes of a participant as independent observations. Participants missing either measurement for a given metric were excluded pairwise, giving n = 13 for GCC analyses and n = 10 for global RNFL analyses.
As a secondary analysis, the same associations were estimated at the level of individual eyes using linear mixed-effects models of the form:
where T denotes the mean T for eye i of participant j, X is the corresponding OCT metric, b is a participant-specific random intercept capturing between-participant variability and accounting for within-participant correlation between eyes, and is the residual error. Models were estimated by restricted maximum likelihood (REML) on 28 or 22 eyes from 14 participants or 11 participants, and the marginal coefficient of determination (R) was computed to quantify the variance explained by the fixed effect of retinal thickness alone. This mixed-effects analysis is reported as a sensitivity analysis and is available for all metrics in the interactive dashboard.
The primary analyses examined associations between mean T across the full 0-15 mm intraorbital segment and the GCC All 1-3 mm average or global RNFL average. Segment-wise analyses were then performed separately for the anterior, middle, and posterior optic nerve segments to determine whether OCT-T associations varied along the intraorbital nerve. Additional sector-wise analyses were conducted across macular ETDRS sectors and peripapillary Garway-Heath sectors using the full intraorbital mean T.
For each fitted model, the marginal coefficient of determination R was computed to quantify the proportion of variance explained by the fixed effect of retinal thickness, rather than the mixed-effects model as a whole. Statistical significance of 1 was assessed using Wald t-tests, and p-values were adjusted for multiple comparisons across sectors using the Benjamini and Hochberg false discovery rate (FDR) procedure 61, applied separately for the macular and optic disc analyses. A standard significance threshold of =0.05 was used after FDR correction.
Influential observations were identified in both analyses. For the participant-level OLS fits, externally studentized residuals, Cook’s distance, and leverage were computed; observations were flagged as outliers when the absolute studentized residual exceeded 2.5, as influential when Cook’s distance exceeded 4/n, and as high-leverage when leverage exceeded 2p/n. For the eye-level mixed-effects models, standardized conditional and empirical best linear unbiased predictor (EBLUP) residuals were computed following the framework for residual analysis in linear mixed models 39. Conditional residuals quantify the deviation of each eye from its model-predicted value after accounting for both the fixed effect of retinal thickness and the participant-level random intercept, whereas EBLUP residuals identify participants whose random intercept deviates from the population distribution; observations and participants with absolute standardized residuals greater than 2 were flagged. Normality of the error structure was verified using the Shapiro-Wilk test applied to least-confounded residuals. Both sets of diagnostics were repeated for each T segment, and for all flagged observations the underlying OCT and T values were examined to determine whether the deviation reflected atypical measurements or a mismatch between the two measures.
Finally, a data application was developed using the Dash framework, serving readers both an interactive dashboard and an API for programmatic access to the data presented in this study. This “wired preprint” concept 62 allows figures to establish live communication with the data application, offering readers interactive engagement without leaving the article. The application is hosted on NeuroLibre 63, which ensures zero-downtime availability in service of this wired preprint.
Disclosures
Large language models (LLMs), including Claude and ChatGPT, were used in the preparation of this manuscript. The core statistical analysis code was written entirely by the authors. LLMs assisted in building the interactive figures and dashboard based on this human-written analytical code. LLMs were also used to refine sentence-level phrasing throughout the text; however, all ideas, structure, and claims originate from the authors, and LLM output was reviewed and edited at every step rather than used unattended.
Acknowledgments
This work was supported by the NYUAD Research Institute Center for Brain and Health, funded by Tamkeen under NYU Abu Dhabi Research Institute grant CG012; the Fonds de Recherche du Québec - Santé (Grant/Award Numbers: 28826; FRSQ-35250); the Natural Sciences and Engineering Research Council of Canada (Grant/Award Number: RGPIN-2022-05308); and the Fonds de recherche du Québec through a CRSNG undergraduate scholarship supplement (Application number: 377291; DOI: Fonds de recherche du Québec (2013)); and the Montréal Heart Institute Foundation.
- Waxman, S. G. (1980). Determinants of conduction velocity in myelinated nerve fibers. Muscle & Nerve, 3(2), 141–150. 10.1002/mus.880030207
- Hoch, M. J., Bruno, M. T., & Shepherd, T. M. (2017). Advanced MRI of the Optic Nerve. Journal of Neuro-Ophthalmology, 37(2), 187–196. 10.1097/wno.0000000000000511
- Shin, H. J., & Costello, F. (2024). Imaging the optic nerve with optical coherence tomography. Eye, 38(12), 2365–2379. 10.1038/s41433-024-03165-3
- Galetta, K. M., Calabresi, P. A., Frohman, E. M., & Balcer, L. J. (2011). Optical Coherence Tomography (OCT): Imaging the Visual Pathway as a Model for Neurodegeneration. Neurotherapeutics, 8(1), 117–132. 10.1007/s13311-010-0005-1
- Petzold, A., de Boer, J. F., Schippling, S., Vermersch, P., Kardon, R., Green, A., Calabresi, P. A., & Polman, C. (2010). Optical coherence tomography in multiple sclerosis: a systematic review and meta-analysis. The Lancet Neurology, 9(9), 921–932. 10.1016/s1474-4422(10)70168-x
- Sakata, L. M., DeLeonOrtega, J., Sakata, V., & Girkin, C. A. (2009). Optical coherence tomography of the retina and optic nerve – a review. Clinical & Experimental Ophthalmology, 37(1), 90–99. 10.1111/j.1442-9071.2009.02015.x
- Bristow, E. A. (2002). The Distribution of Mitochondrial Activity in Relation to Optic Nerve Structure. Archives of Ophthalmology, 120(6), 791. 10.1001/archopht.120.6.791
- Curcio, C. A., & Allen, K. A. (1990). Topography of ganglion cells in human retina. Journal of Comparative Neurology, 300(1), 5–25. 10.1002/cne.903000103
- Gala, F. (2015). Magnetic resonance imaging of optic nerve. Indian Journal of Radiology and Imaging, 25(04), 421–438. 10.4103/0971-3026.169462
- Miller, D. H., Newton, M. R., van der Poel, J. C., du Boulay, E. P. G. H., Halliday, A. M., Kendall, B. E., Johnson, G., MacManus, D. G., Moseley, I. F., & McDonald, W. I. (1988). Magnetic resonance imaging of the optic nerve in optic neuritis. Neurology, 38(2), 175–175. 10.1212/wnl.38.2.175
- Filippi, M., Preziosa, P., Banwell, B. L., Barkhof, F., Ciccarelli, O., De Stefano, N., Geurts, J. J. G., Paul, F., Reich, D. S., Toosy, A. T., Traboulsee, A., Wattjes, M. P., Yousry, T. A., Gass, A., Lubetzki, C., Weinshenker, B. G., & Rocca, M. A. (2019). Assessment of lesions on magnetic resonance imaging in multiple sclerosis: practical guidelines. Brain, 142(7), 1858–1875. 10.1093/brain/awz144
- Xena-Bosch, C., Kodali, S., Sahi, N., Chard, D., Llufriu, S., Toosy, A. T., Martinez-Heras, E., & Prados, F. (2025). Advances in MRI optic nerve segmentation. Multiple Sclerosis and Related Disorders, 98, 106437. 10.1016/j.msard.2025.106437
- Simon, J. H., Szumowski, J., Totterman, S., Kido, D., Ekholm, S., Wicks, A., & Plewes, D. (1988). Fat-Suppression MR Imaging of the Orbit. American Journal of Neuroradiology, 9(5), 961–968. http://www.ajnr.org/content/9/5/961
- Varma, D. R., Ponnaganti, S., & Dandu, R. V. (2020). Beware of artifacts in orbital magnetic resonance imaging. Indian Journal of Ophthalmology, 68(11), 2516–2518. 10.4103/ijo.IJO_640_20
- van Elst, S., de Bloeme, C. M., Noteboom, S., de Jong, M. C., Moll, A. C., Göricke, S., De Graaf, P., & Caan, M. W. A. (2023). Automatic segmentation and quantification of the optic nerve on MRI using a 3D U-Net. Journal of Medical Imaging, 10(03). 10.1117/1.jmi.10.3.034501