Results: atlas level
Contents
import warnings

warnings.filterwarnings("ignore")
from fmriprep_denoise.dataset.atlas import ATLAS_METADATA
from fmriprep_denoise.visualization import figures, utils

import ipywidgets as widgets
from ipywidgets import interactive, interact


path_root = utils.repo2data_path() / "denoise-metrics"
---- repo2data starting ----
/srv/conda/envs/notebook/lib/python3.8/site-packages/repo2data
Config from file :
/home/jovyan/binder/data_requirement.json
Destination:
../../data/fmriprep-denoise-benchmark

Info : ../../data/fmriprep-denoise-benchmark already downloaded
Results: atlas level#
Important
The dropdown menu only works in interactive mode! Please launch binder to see the alterative results.
It is possible to view the data at atlas level!
In the report we used four atlases, three of them came with multiple parcellation schemes.
Gordon atlas [Gordon et al., 2014]: 333
Schaefer 7 network atlas [Schaefer et al., 2017]: 100, 200, 300, 400, 500, 600, 800
Multiresolution Intrinsic Segmentation Template (MIST) [Urchs et al., 2019]: 7, 12, 20, 36, 64, 122, 197, 325, 444, “ROI” (210 parcels, 122 split by the midline)
DiFuMo [Dadi et al., 2020]: 64, 128, 256, 512, 1024
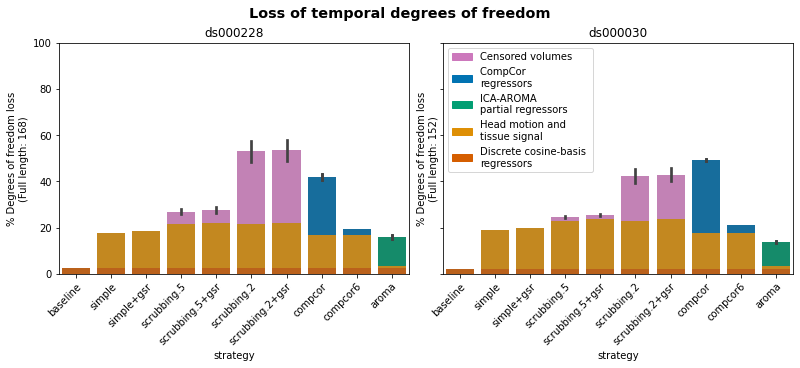
Before we start: Loss of temporal degrees of freedom#
As any denoising strategy aims at a particular trade-off between the amount of noise removed and the preservation of degrees of freedom for signals, first and foremost, we would like to presentthe loss of temporal degrees of freedom.
This is an important consideration accompanying the remaining metrics.
from fmriprep_denoise.visualization import degrees_of_freedom_loss


def notebook_plot_loss_degrees_of_freedom(criteria_name, fmriprep_version):
    datasets = ["ds000228", "ds000030"]
    data = degrees_of_freedom_loss.load_data(
        path_root, datasets, criteria_name, fmriprep_version
    )
    degrees_of_freedom_loss.plot_stats(data)


criteria_name = widgets.Dropdown(
    options=["stringent", "minimal", None],
    value="stringent",
    description="Threshould: ",
    disabled=False,
)
fmriprep_version = widgets.Dropdown(
    options=["fmriprep-20.2.1lts", "fmriprep-20.2.5lts"],
    value="fmriprep-20.2.1lts",
    description="Preporcessing version : ",
    disabled=False,
)

interactive(
    notebook_plot_loss_degrees_of_freedom,
    criteria_name=criteria_name,
    fmriprep_version=fmriprep_version,
)
Each parcellation scheme#
We can also plot them by each parcellation schemes.
This is the original way Ciric and colleagues [Ciric et al., 2017] presented their results!
Gordon atlas#
atlas = "gordon333"
dataset = widgets.Dropdown(
options=["ds000228", "ds000030"], description="Dataset : ", disabled=False
)
fmriprep_version = widgets.Dropdown(
options=["fmriprep-20.2.1lts", "fmriprep-20.2.5lts"],
description="fmriprep : ",
disabled=False,
)
dimension = widgets.Dropdown(
description="dimensions : ",
options=ATLAS_METADATA[atlas]["dimensions"],
disabled=False,
)
@interact(ds=dataset, f=fmriprep_version, d=dimension)
def show_atlas(ds, f, d):
print(ds, f, ATLAS_METADATA[atlas]["atlas"], "dimensions: ", d)
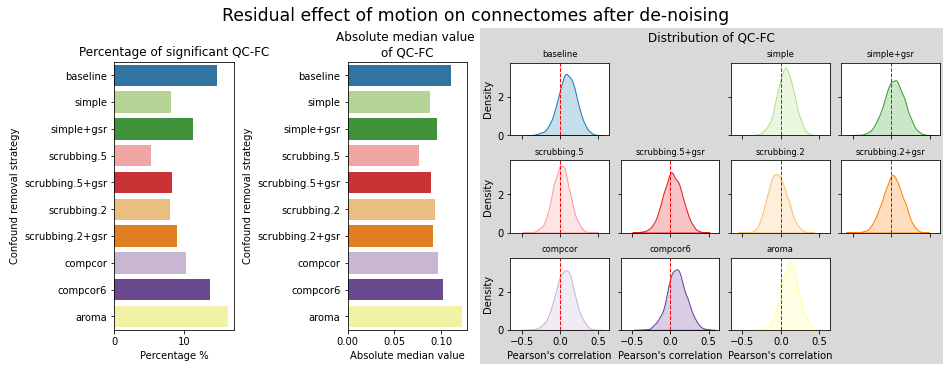
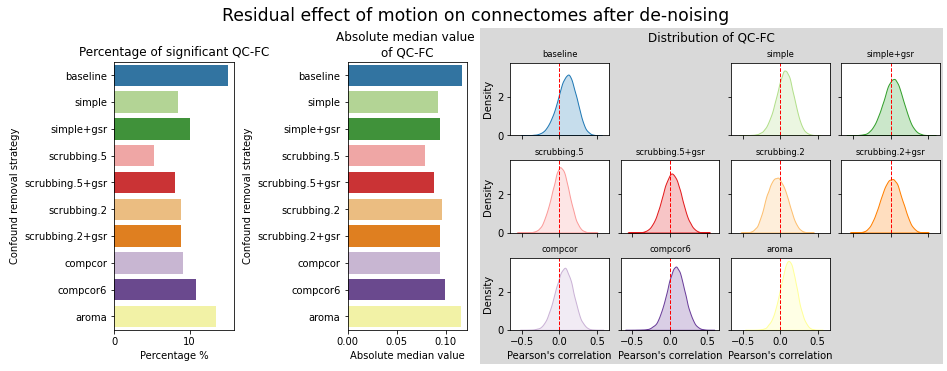
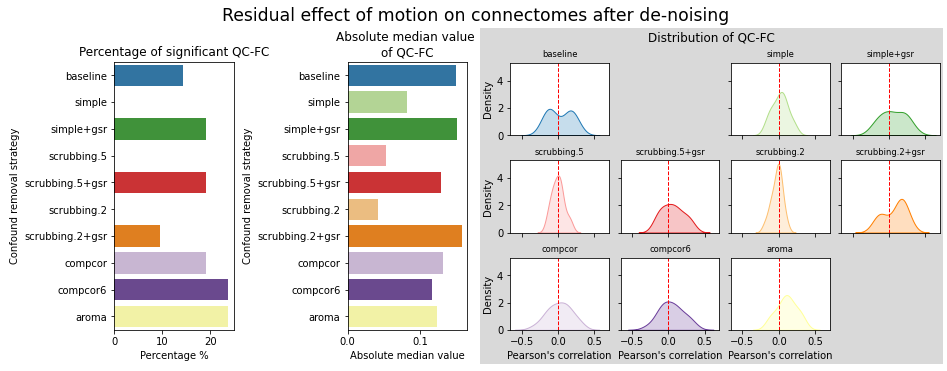
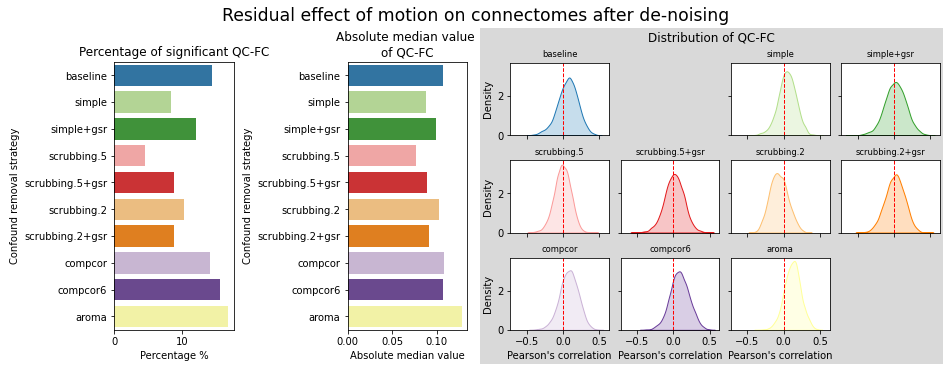
figures.plot_motion_resid(ds, f, path_root, atlas_name=atlas, dimension=d)
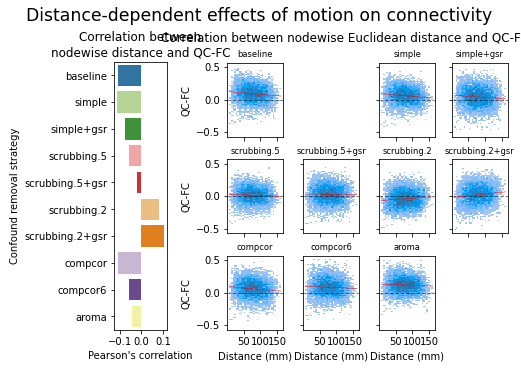
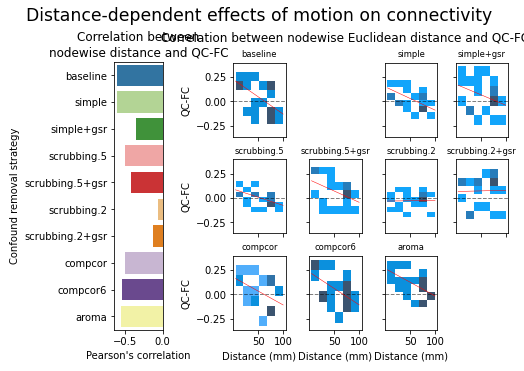
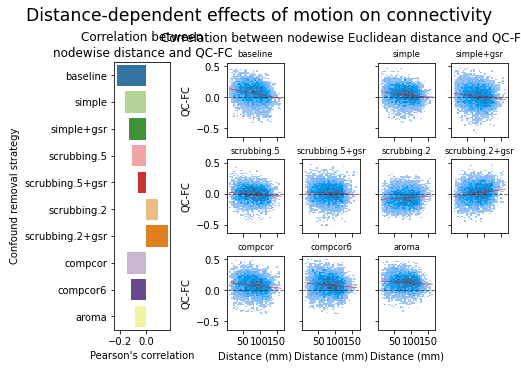
figures.plot_distance_dependence(ds, f, path_root, atlas_name=atlas, dimension=d)
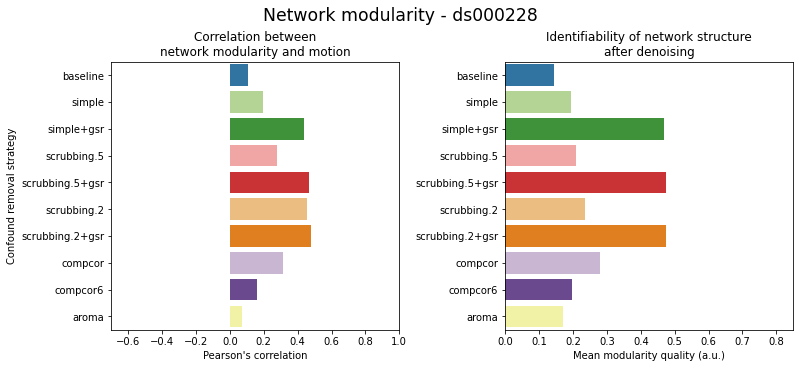
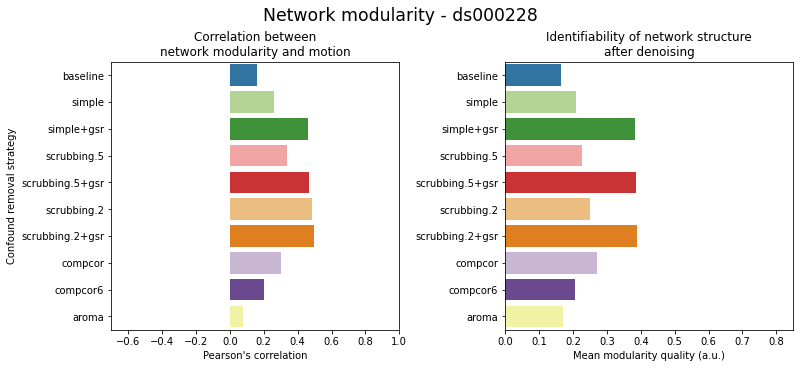
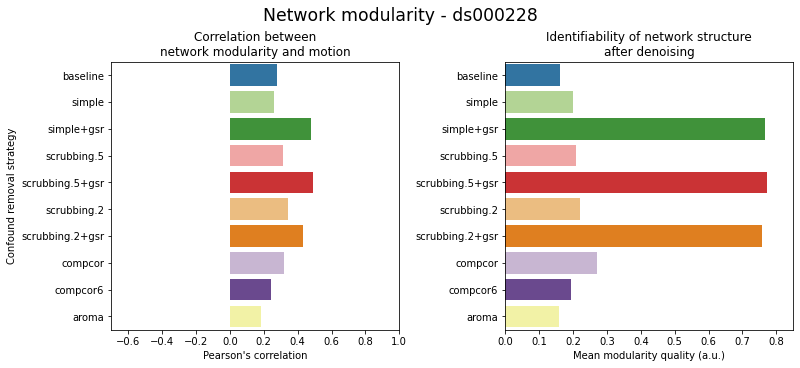
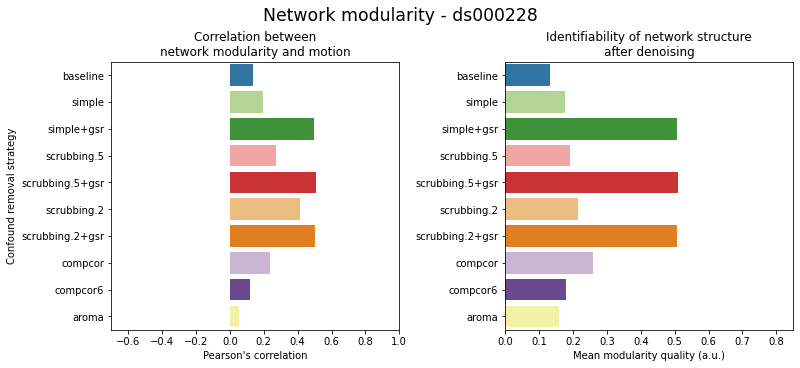
figures.plot_network_modularity(ds, f, path_root, atlas_name=atlas, dimension=d)

MIST#
If selecting None for dimension, the figure will summmarise the metrics by the atlas collection.
Important
The summary statistics are computed on the fly, it might take a bit of time, especially when displaying summary of the atlas collection.
atlas = "mist"

dataset = widgets.Dropdown(
    options=["ds000228", "ds000030"], description="Dataset : ", disabled=False
)
fmriprep_version = widgets.Dropdown(
    options=["fmriprep-20.2.1lts", "fmriprep-20.2.5lts"],
    description="fmriprep : ",
    disabled=False,
)
dimension = widgets.Dropdown(
    description="dimensions : ",
    options=ATLAS_METADATA[atlas]["dimensions"] + [None],
    disabled=False,
)

@interact(ds=dataset, f=fmriprep_version, d=dimension)
def show_atlas(ds, f, d):
    print(ds, f, ATLAS_METADATA[atlas]["atlas"], "dimensions: ", d)
    figures.plot_motion_resid(ds, f, path_root, atlas_name=atlas, dimension=d)
    figures.plot_distance_dependence(ds, f, path_root, atlas_name=atlas, dimension=d)
    figures.plot_network_modularity(ds, f, path_root, atlas_name=atlas, dimension=d)
Schaefer 7 network#
If selecting None for dimension, the figure will summmarise the metrics by the atlas collection.
Important
The summary statistics are computed on the fly, it might take a bit of time, especially when displaying summary of the atlas collection.
atlas = "schaefer7networks"

dataset = widgets.Dropdown(
    options=["ds000228", "ds000030"], description="Dataset : ", disabled=False
)
fmriprep_version = widgets.Dropdown(
    options=["fmriprep-20.2.1lts", "fmriprep-20.2.5lts"],
    description="fmriprep : ",
    disabled=False,
)
dimension = widgets.Dropdown(
    description="dimensions : ",
    options=ATLAS_METADATA[atlas]["dimensions"] + [None],
    disabled=False,
)

@interact(ds=dataset, f=fmriprep_version, d=dimension)
def show_atlas(ds, f, d):
    print(ds, f, ATLAS_METADATA[atlas]["atlas"], "dimensions: ", d)
    figures.plot_motion_resid(ds, f, path_root, atlas_name=atlas, dimension=d)
    figures.plot_distance_dependence(ds, f, path_root, atlas_name=atlas, dimension=d)
    figures.plot_network_modularity(ds, f, path_root, atlas_name=atlas, dimension=d)
DiFuMo#
If selecting None for dimension, the figure will summmarise the metrics by the atlas collection.
Important
The summary statistics are computed on the fly, it might take a bit of time, especially when displaying summary of the atlas collection.
atlas = "difumo"

dataset = widgets.Dropdown(
    options=["ds000228", "ds000030"], description="Dataset : ", disabled=False
)
fmriprep_version = widgets.Dropdown(
    options=["fmriprep-20.2.1lts", "fmriprep-20.2.5lts"],
    description="fmriprep : ",
    disabled=False,
)
dimension = widgets.Dropdown(
    description="dimensions : ",
    options=ATLAS_METADATA[atlas]["dimensions"] + [None],
    disabled=False,
)

@interact(ds=dataset, f=fmriprep_version, d=dimension)
def show_atlas(ds, f, d):
    print(ds, f, ATLAS_METADATA[atlas]["atlas"], "dimensions: ", d)
    figures.plot_motion_resid(ds, f, path_root, atlas_name=atlas, dimension=d)
    figures.plot_distance_dependence(ds, f, path_root, atlas_name=atlas, dimension=d)
    figures.plot_network_modularity(ds, f, path_root, atlas_name=atlas, dimension=d)