Abstract
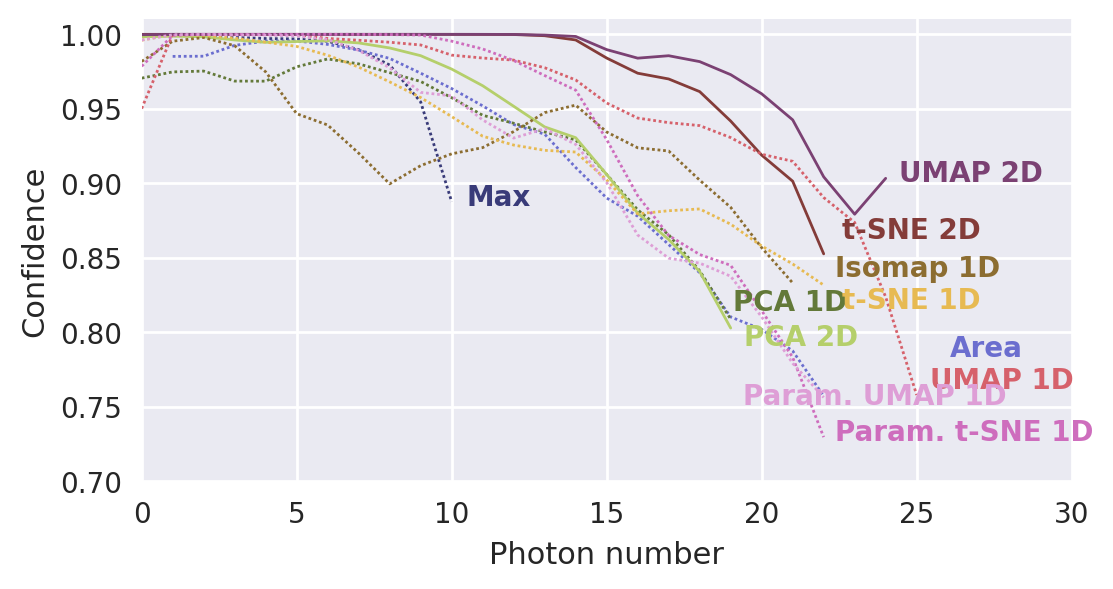
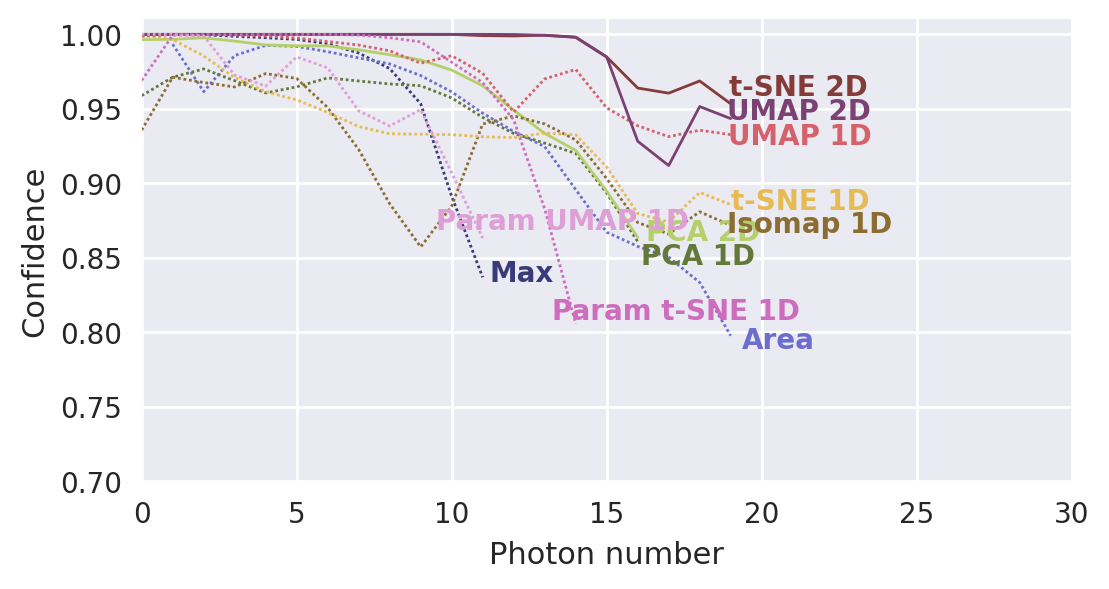
We compare methods for signal classification applied to voltage traces from transition-edge sensors (TES) which are photon-number resolving detectors fundamental for accessing quantum advantages in information processing, communication and metrology. We quantify the impact of numerical analysis on the distinction of such signals. Furthermore, we explore dimensionality reduction techniques to create interpretable and precise photon-number embeddings. We demonstrate that the preservation of local data structures of some nonlinear methods is an accurate way to achieve unsupervised classification of TES traces. We do so by considering a confidence metric that quantifies the overlap of the photon-number clusters inside a latent space. Furthermore, we demonstrate that for our dataset previous methods such as the signal’s area and principal component analysis can resolve up to 16 photons with confidence above while nonlinear techniques can resolve up to 21 with the same confidence threshold. Also, we showcase implementations of neural networks to leverage information within local structures, aiming to increase confidence in assigning photon numbers. Finally, we demonstrate the advantage of some nonlinear methods to detect and remove outlier signals.
2Introduction
Photonics is a strong contender for building large-scale quantum information processing systems Arrazola et al., 2021Slussarenko & Pryde, 2019Rudolph, 2017Bourassa et al., 2021Maring et al., 2024; in many of these systems, photon-number detection plays an essential role, serving as a resource for quantum advantage. Photonic architectures often encode information in continuous variables or in multi-photon states, where precise knowledge of photon number is critical for state preparation, measurement, and error correction. For example, photon-number-resolving detectors have been used for the generation of non-Gaussian states Takase et al., 2024Alexander et al., 2024Yao et al., 2024Chen et al., 2024Melalkia et al., 2023Tiedau et al., 2019Sonoyama et al., 2024Endo et al., 2024Gerrits et al., 2010Thekkadath et al., 2020Larsen et al., 2025, for the sampling of classically-intractable probability distributions Aaronson & Arkhipov, 2011Hamilton et al., 2017Kruse et al., 2017Deshpande et al., 2022Grier et al., 2022Madsen et al., 2022, or for directly resolving multiple quanta, thereby improving the Fisher information in interferometric protocols Thekkadath et al., 2020Wildfeuer et al., 2009You et al., 2021. In such protocols, quantum states of light such as N00N or Holland-Burnett states can, in principle, achieve a precision scaling of (for detected photons), surpassing classical limits. However, this quantum advantage is highly sensitive to loss, making efficient photon-number resolution particularly valuable. The use of photon-number resolving detectors offers a significant advantage, as a single device can accurately determine the number of photons in a quantum state Divochiy et al., 2008Morais et al., 2024, thereby eliminating the need for a demultiplexed network of threshold detectors, which adds complexity and can reduce overall efficiency Kruse et al., 2017Jönsson & Björk, 2019Jönsson et al., 2020. Transition-edge sensors (TES) have been used for this task, offering resolution over a wide energy range. Resolutions up to 30 photons have been demonstrated Eaton et al., 2023, although this quantity is typically lower, on the order of 17 Morais et al., 2024.
TESs exploit the superconducting phase transition of photosensitive materials (illustrated inFigure 1) to achieve an extremely sensitive calorimeter Irwin & Hilton, 2005. During operation, the material is cooled below its critical temperature and then current-biased to the transition region between its superconducting and normal state. In this region, the temperature increase following the absorption of a single photon leads to a measurable change in the material’s resistance Phillips, 2020Hadfield, 2009. The resistance change is read-out using a low noise amplifier such as superconducting quantum interference devices (SQUIDs), which also enable the creation of large arrays of TES detectors via read-out multiplexing Irwin & Hilton, 2005. Optimized materials and coupling techniques have demonstrated system efficiencies of up to 98% Fukuda et al., 2011.
The readout of these devices is non-trivial as the quantity one wants to determine, the energy (or the photon number for monochromatic light), is reflected in a nonlinear fashion in the voltage signal produced by the detectors’ electronics Gerrits et al., 2012. Historically, the integral (area) of the signals has been used to assign photon numbers Morais et al., 2024Schmidt et al., 2021. However, distinguishing large photon numbers becomes challenging with this technique. To address this issue, linear techniques such as Principal Component Analysis (PCA) have been used Humphreys et al., 2015. A machine learning method, adapted from the K-means algorithm to account for the Poissonian statistics of laser sources, has also been developed Levine et al., 2012. However, these methods’ simplicity or assumptions can limit their performance or usability for model-free photon-number detection and when measuring non-classical sources, which typically do not have Poisson photon-number statistics.
With the increased popularity of machine learning in the field of signal processing Rajendran et al., 2018 and quantum systems Nautrup et al., 2019, one might naturally ask whether employing more sophisticated methods could lead to enhanced resolution of photon numbers. In this work, we answer this question by assessing the performance of multiple techniques for photon number classification using TES signals. We do so by considering a confidence metric that quantifies the overlap of the photon-number clusters inside a latent space. We demonstrate that for our dataset previous methods such as the signal’s area and PCA can resolve up to 16 photons with confidence above while nonlinear techniques can resolve up to 21 with the same confidence threshold. Furthermore, we also showcase implementations of neural networks to leverage information within local structures, aiming to increase confidence in assigning photon numbers. Finally, we demonstrate the advantage of some nonlinear methods to detect and remove outlier signals.
Our manuscript is structured as follows: in the next section, we formulate the problem of photon-number discrimination in the general setting of unsupervised classification and dimensionality reduction. We give an overview of the Section 3 and finally present our Section 4 using experimental data.
3Methodology
3.1Problem Formulation
Consider a data matrix that stores signals of size . We assume there exists an operation that can transform into a vector that contains the photon number associated with every signal. The goal of the classification becomes finding a parametric transformation with user-defined parameters that approximates as closely as possible the true transformation .
The problem is defined as an unsupervised classification, meaning the true elements of are unknown. Additionally, given an experiment, the method needs to accept arbitrarily high photon numbers within the visibility limit of the detector.
3.2Dimensionality Reduction
To solve this unsupervised classification problem, dimensionality reduction techniques are used. This process describes the transformation of into a lower-dimensional output that retains a meaningful amount of the input information. The new space of dimension is referred to as a latent space and is limited to one and two dimensions in this study. The proposed approach could be used for an arbitrarily large latent space, although these higher dimensional spaces are harder to interpret.
We use dimensionality reduction since it is a natural extension of previous work that uses PCA Humphreys et al., 2015. Moreover, this framework is used to make the current work compatible with existing tomography routines Humphreys et al., 2015. It also enables the visualization and interpretation of an entire dataset, a task difficult by directly observing the TES signals. Supposing an accurate transformation exists and is faster to process than the acquisition rate of the detector, the low-dimensional representation reduces the memory requirements of experiments by acting as a compression step.

Figure 1:Circuit diagram of a typical transition-edge sensor detection scheme. The circuit can change slightly from one implementation to the other, the illustrated circuit is based on Ref.Morais et al., 2024. The superconducting phase transition of the TES is illustrated through the sharp variation of resistance as a function of temperature, giving the TES extremely sensitive energy resolution Thekkadath, 2020.
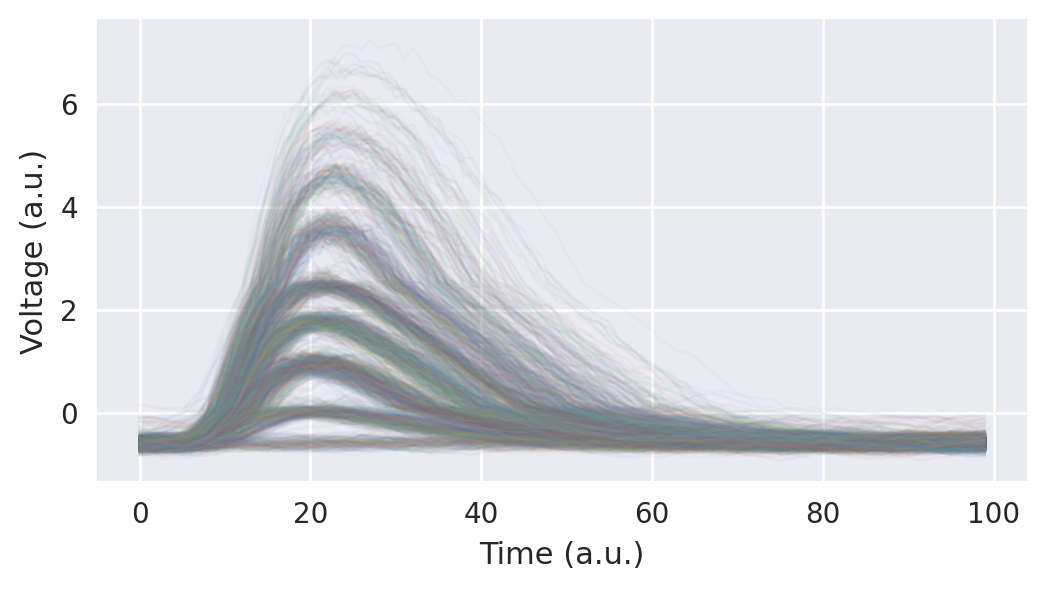
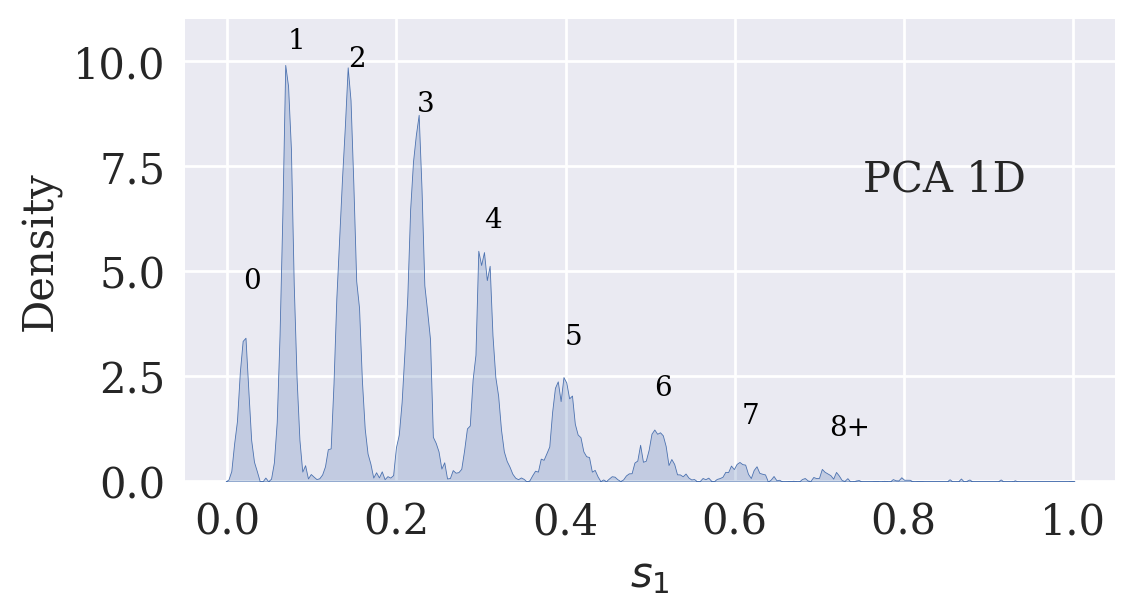
Figure 3:The dataset X is transformed into Y which has a single dimension (), here plotted using a kernel density estimation Seaborn.Kdeplot — Seaborn 0.13.2 Documentation, 2024. The dimensionality reduction technique (maximum value of the signals in this case) creates a low-dimensional space where signal features become apparent. Each peak is a cluster that represents the underlying dominant feature of the signals: the photon numbers.
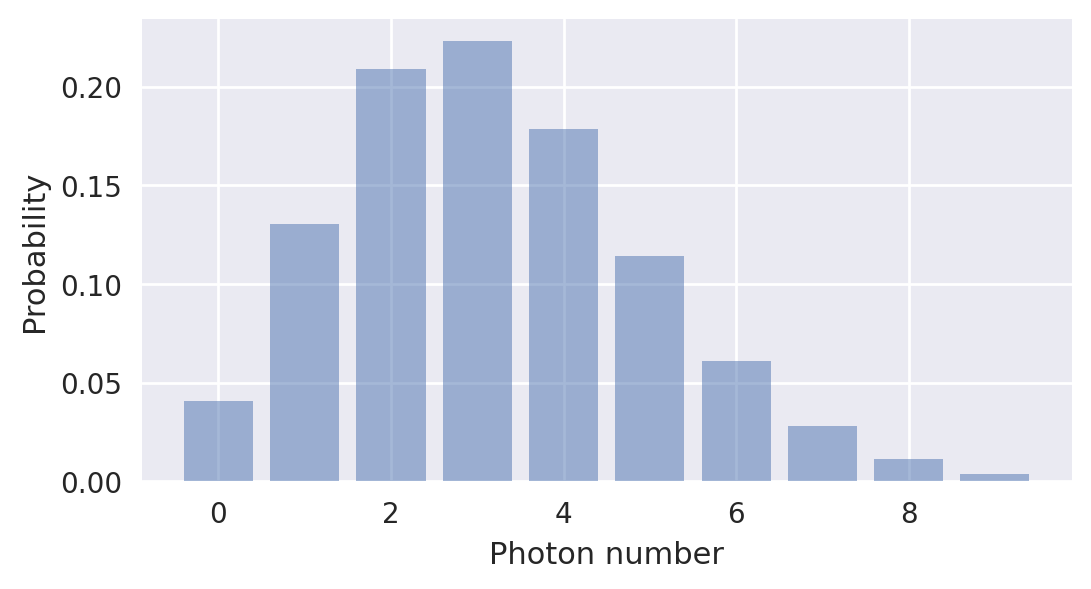
Figure: Steps associated with the photon number detection process going from the device in Figure 1 and the expected output signals in Figure 2 to the abstract space describing similarities between samples in Figure 3 and the final photon number distribution associated with an experiment in Figure 4.
Considering every signal in can be associated with a photon number , where is the photon-number cutoff, i.e., the largest distinguishable photon number. We assume that effective dimensionality reduction organizes similar samples near each other, forming regions of high density.
We illustrate the process in Figure 3 by transforming the TES signals (Figure 2) into one-dimensional samples presented in Figure 3. This low dimensional space is visualized using a kernel density estimation of the latent space (Gaussian kernel) Seaborn.Kdeplot — Seaborn 0.13.2 Documentation, 2024. From the position of the samples in the latent space (never considering the density estimation in the computation) it is possible to find regions most likely to describe a photon number . We discuss this step in Sec. 3.3. Finally, from this interpretation of the low-dimensional space, a photon number can be assigned to every sample (Figure 4). The regions of high density in Figure 3 are called clusters and are associated with photon numbers. We note that clusters can be defined using other heuristics like neighbour distances.
An additional justification for the use of dimensionality reduction in combination with clustering instead of directly clustering over high dimensional data is that existing work has empirically demonstrated that creating a low dimensionality embedding increases the clustering capabilities in unsupervised settings Allaoui et al., 2020.
3.3Clustering
Clustering refers to identifying groups of similar samples inside a latent space. For this task we use a Gaussian mixture model, given a user-defined number of clusters, this method finds the parameters of a mixture of Gaussians to describe the sample’s distribution.
The choice is highly inspired by a similar model previously used in the tomography of TESs in combination with PCA Humphreys et al., 2015. Mixture models offer a statistical interpretation of latent spaces convenient for metrology and performance evaluation (confidence metric in Sec. 3.4).
The mixture model gives a continuous probability density function for the position of samples given optimal parameters , . In the model, every cluster is weighted by a value (where ), and modelled by a Gaussian with mean and covariance matrices . The individual Gaussians give the cluster probability density function and the probability of observing samples in position given parameters are defined by
The probability density function is found through an expectation maximization algorithm (EM algorithm) that attempts to find the maximum likelihood estimate of samples following a likelihood of
Numerically it is more convenient to express this problem in terms of the log-likelihood given by
where the problem can be computed in terms of sum instead of products.
After computing the Gaussian mixture, photon numbers are assigned based on the average area of the samples inside each cluster. The mean area provides a reference for the cluster ordering, since a signal’s area grows with energy and, consequently, the number of photons. This task is unambiguous because the average areas are well separated, unlike the individual samples.
3.4Quality Assessment
Assessing the performance of dimensionality reduction techniques in an unsupervised setting is difficult since the ground truth is unknown. To tackle this task, we quantify cluster separation. To improve the performance evaluation it is also important to understand that the problem is not completely unsupervised considering photon sources used to generate samples follow known distributions. We include this knowledge of photon number distributions as an additional validation to cluster separation evaluation in the confidence metric.
We consider the probability density of photon events can be approximated from the sample’s distribution in the latent space following the Gaussian mixture model. Following previous work Humphreys et al., 2015, the confidence is used as a performance metric for the resolution of photon numbers in a latent space following,
In this equation, is the probability density of observing a sample in position in the latent space given it is labelled as photons. Additionally, is the probability of assigning a photon number . In this model, we consider that the true clusters follow a Gaussian structure inside the latent space. The confidence represents the probability of correctly labelling a sample in a given cluster in the mixture model. We note that that confidence equation describes the confidence for a one-dimensional space but can be generalized to an arbitrarily high-dimensional latent space. It is important to mention that the distances in the latent space do not necessarily have a physical meaning. The separation must only be interpreted as our capacity to distinguish clusters, and the confidence translates this concept into a probabilistic framework.
3.5Datasets
Experimental data from previous work at the National Institute of Standards and Technologies (NIST) is used to benchmark the different techniques in this work Gerrits et al., 2012. The original dataset was generated by progressively attenuating a coherent source from 29dB to 7dB, leading to 24 datasets each containing signals and time steps. This results in datasets that each have Poisson photon number distributions and mean photon number to . These values were independently measured using a calibrated photodetector.
Instead of directly using these distributions, we construct two synthetic datasets (made of real traces) that follow a close-to-uniform and close-to-geometric distributions . These datasets are labelled as Synthetic Uniform and Synthetic Geometric. Furthermore, for both of these datasets, a training and testing set were generated. Considering randomly selecting a portion of the samples in each experiment is equivalent to varying the weight of a given Poisson distribution inside a mixture of Poisson distributions. The total expected distribution can be described by
with
and where is the set of available mean photon numbers . With this construction, the expected photon number distribution is a mixture of Poisson distributions. The choice of a uniform distribution is motivated by the desire to make the labelling task difficult by maximizing the distribution’s entropy. In other words, for every sample in a perfectly uniform distribution, the method would have equal chances of guessing every class. The choice of testing a geometric distribution comes from the desire to precisely measure thermal optical sources that follow a geometric photon number distribution. Also, distributions with a long tail can be difficult to process for certain methods since fewer examples are present in some classes (imbalanced dataset).
We add that these expected distributions are used as in the computation of the confidence. The predictive methods are trained with the training set, and the analysis of performance metrics is done by feeding the test set to the trained methods. In the case of non-predictive and basic feature methods, the test set is directly used. The training and test datasets contain a total of traces of size (first 350 values of the 8192 available time steps). We note that most of the weights are set to zero because of the number of available Poisson distributions in the desired photon number range is small, making the synthetic distribution not perfectly uniform.
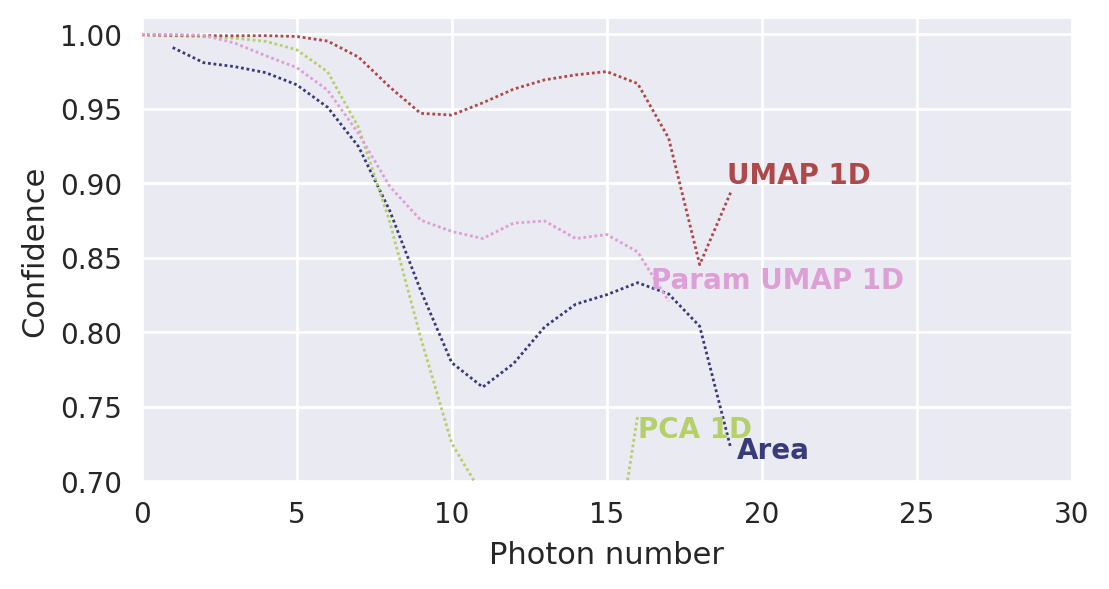
To validate the hypothesis that more training data can help parametric implementations of t-SNE and UMAP resemble there non-parametric equivalent, we also use a larger dataset named Synthetic Large that was created using signals generated by TESs at the National Research Council Canada (NRC) in Ottawa. The data was generated by tuning the attenuation of a laser and measuring signals for each of these coherent sources.
4Results
We present the confidence result for the different datasets and considering a variety of dimensionality reduction techniques.
4.1Synthetic Uniform
4.2Synthetic Geometric
4.3Synthetic Large
- Arrazola, J. M., Bergholm, V., Brádler, K., Bromley, T. R., Collins, M. J., Dhand, I., Fumagalli, A., Gerrits, T., Goussev, A., Helt, L. G., Hundal, J., Isacsson, T., Israel, R. B., Izaac, J., Jahangiri, S., Janik, R., Killoran, N., Kumar, S. P., Lavoie, J., … Zhang, Y. (2021). Quantum circuits with many photons on a programmable nanophotonic chip. Nature, 591(7848), 54–60. 10.1038/s41586-021-03202-1
- Slussarenko, S., & Pryde, G. J. (2019). Photonic quantum information processing: A concise review. Appl. Phys. Rev., 6(4). 10.1063/1.5115814
- Rudolph, T. (2017). Why I am optimistic about the silicon-photonic route to quantum computing. APL Photonics, 2(3).
- Bourassa, J. E., Alexander, R. N., Vasmer, M., Patil, A., Tzitrin, I., Matsuura, T., Su, D., Baragiola, B. Q., Guha, S., Dauphinais, G., & others. (2021). Blueprint for a scalable photonic fault-tolerant quantum computer. Quantum, 5, 392. 10.22331/q-2021-02-04-392
- Maring, N., Fyrillas, A., Pont, M., Ivanov, E., Stepanov, P., Margaria, N., Hease, W., Pishchagin, A., Lemaı̂tre, A., Sagnes, I., & others. (2024). A versatile single-photon-based quantum computing platform. Nat. Photonics, 18(6), 603–609.
- Takase, K., Hanamura, F., Nagayoshi, H., Bourassa, J. E., Alexander, R. N., Kawasaki, A., Asavanant, W., Endo, M., & Furusawa, A. (2024). Generation of flying logical qubits using generalized photon subtraction with adaptive Gaussian operations. Phys. Rev. A, 110(1), 012436. 10.1103/physreva.110.012436
- Alexander, K., Bahgat, A., Benyamini, A., Black, D., Bonneau, D., Burgos, S., Burridge, B., Campbell, G., Catalano, G., Ceballos, A., & others. (2024). A manufacturable platform for photonic quantum computing. arXiv Preprint arXiv:2404.17570.
- Yao, Y., Miatto, F., & Quesada, N. (2024). Riemannian Optimization of Photonic Quantum Circuits in Phase and Fock Space. Scipost Phys., 17(3), 082. 10.21468/SciPostPhys.17.3.082
- Chen, Y.-R., Hsieh, H.-Y., Ning, J., Wu, H.-C., Chen, H. L., Shi, Z.-H., Yang, P., Steuernagel, O., Wu, C.-M., & Lee, R.-K. (2024). Generation of heralded optical cat states by photon addition. Phys. Rev. A, 110(2), 023703.
- Melalkia, M., Huynh, J., Tanzilli, S., d’Auria, V., & Etesse, J. (2023). A multiplexed synthesizer for non-Gaussian photonic quantum state generation. Quantum Sci. Technol., 8(2), 025007. 10.1088/2058-9565/acb4b8
- Tiedau, J., Bartley, T. J., Harder, G., Lita, A. E., Nam, S. W., Gerrits, T., & Silberhorn, C. (2019). Scalability of parametric down-conversion for generating higher-order Fock states. Phys. Rev. A, 100(4), 041802. 10.1103/PhysRevA.100.041802
- Sonoyama, T., Takahashi, K., Sano, T., Suzuki, T., Nomura, T., Yabuno, M., Miki, S., Terai, H., Takase, K., Asavanant, W., Endo, M., & Furusawa, A. (2024). Generation of Multi-Photon Fock States at Telecommunication Wavelength Using Picosecond Pulsed Light. Opt. Express, 32(18), 32387–32395. 10.1364/OE.530164
- Endo, M., Takahashi, K., Nomura, T., Sonoyama, T., Yabuno, M., Miki, S., Terai, H., Kashiwazaki, T., Inoue, A., Umeki, T., & others. (2024). Optically-Sampled Superconducting-Nanostrip Photon-Number Resolving Detector for Non-Classical Quantum State Generation. arXiv Preprint arXiv:2405.06901.
- Gerrits, T., Glancy, S., Clement, T. S., Calkins, B., Lita, A. E., Miller, A. J., Migdall, A. L., Nam, S. W., Mirin, R. P., & Knill, E. (2010). Generation of Optical Coherent-State Superpositions by Number-Resolved Photon Subtraction from the Squeezed Vacuum. Physical Review A, 82(3), 031802. 10.1103/PhysRevA.82.031802
- Thekkadath, G. S., Bell, B. A., Walmsley, I. A., & Lvovsky, A. I. (2020). Engineering Schrödinger Cat States with a Photonic Even-Parity Detector. Quantum, 4, 239. 10.22331/q-2020-03-02-239