Synthetic Geometric
from src.Utils import save_results, get_means
from src.ExistingAlgorithms import max_value, area, sklearn_available
from src.Parametric_UMAP import load_pumap
from src.GaussianMixture import gaussian_mixture
from src.Parametric_TSNE.train import load_model
from src.Parametric_TSNE.model import Network
from src.Dataset import dataset_dat

from sklearn.decomposition import PCA, KernelPCA, NMF
from sklearn.manifold import Isomap, TSNE

import umap
import torch1Data
SKIP = 1
# DATA
PATH_DATA = '../data/photon-number-classification/data_boulder'
PATH_RANDOM = 'Preprocess/Geometric/randomIndexGeometric.npy'
# PREPROCESS
PATH_INIT_MEANS = 'Preprocess/Geometric/Mean_Clusters'
PATH_SAVE_LD = 'Preprocess/Geometric/Low_Dimension'
# SAVE PLOTS
PATH_SAVE_D = 'Results/Geometric/Density'
PATH_RESULTS = 'Results/Geometric'

weights = [0.07051088775512344, 0.21031270568057314, 0.38445365365055423, 0.6780434874139336,
           0.6001082447024342, 0.9999999999999999, 0.629191619746778, 1.1954682934335052e-17,
           0.9999999799606453, 0.9999999999649708]

data_train, data_test, expected_prob, db_train, db_test = dataset_dat(
   weights = weights,
   path_data = PATH_DATA,
   path_random_index = PATH_RANDOM,
   signal_size = 8192,
   interval = [0,350],
   standardize = True,
   plot_expected = True,
   plot_traces = False,
   n_photon_number = 50
)

data_train.shape
data_train, data_test, db_train, db_test = data_train[::SKIP], data_test[::SKIP], db_train[::SKIP], db_test[::SKIP]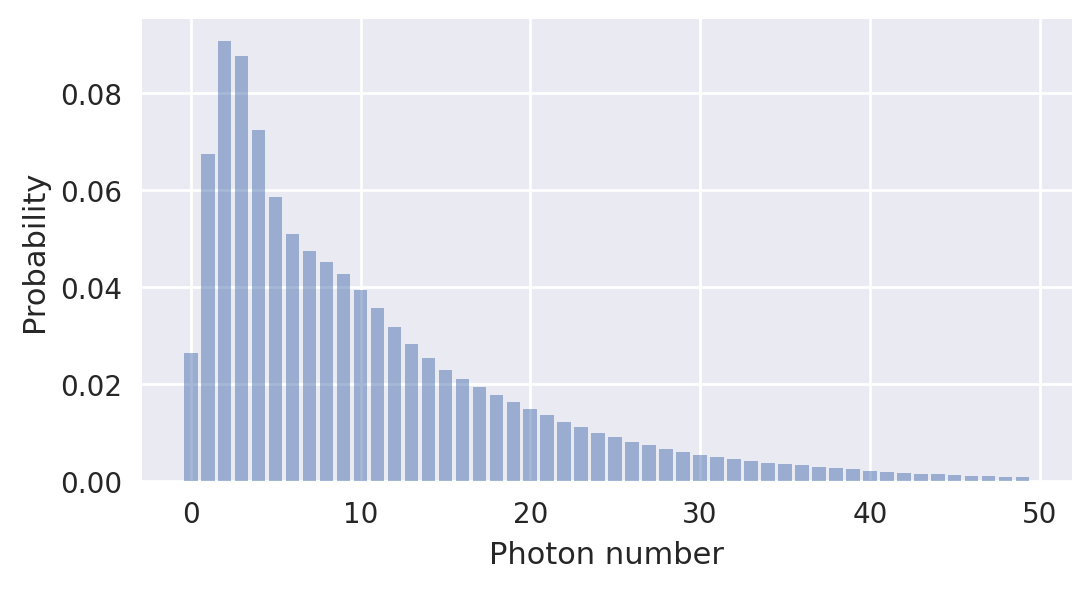
2Methods
2.1Max Value
X_l_MAX = max_value(
   X_high = data_test,
   filtering = True,
   save_path = PATH_SAVE_LD
)
X_l_MAX.shape
(57020, 1)name_method = 'MAX'
gm = gaussian_mixture(
X_low = X_l_MAX,
X_high = data_test,
means_init = get_means(name_method, PATH_INIT_MEANS),
number_cluster = 18,
tol = 1e-4,
cluster_iter = 10,
width_plot=6,
height_plot=3
)
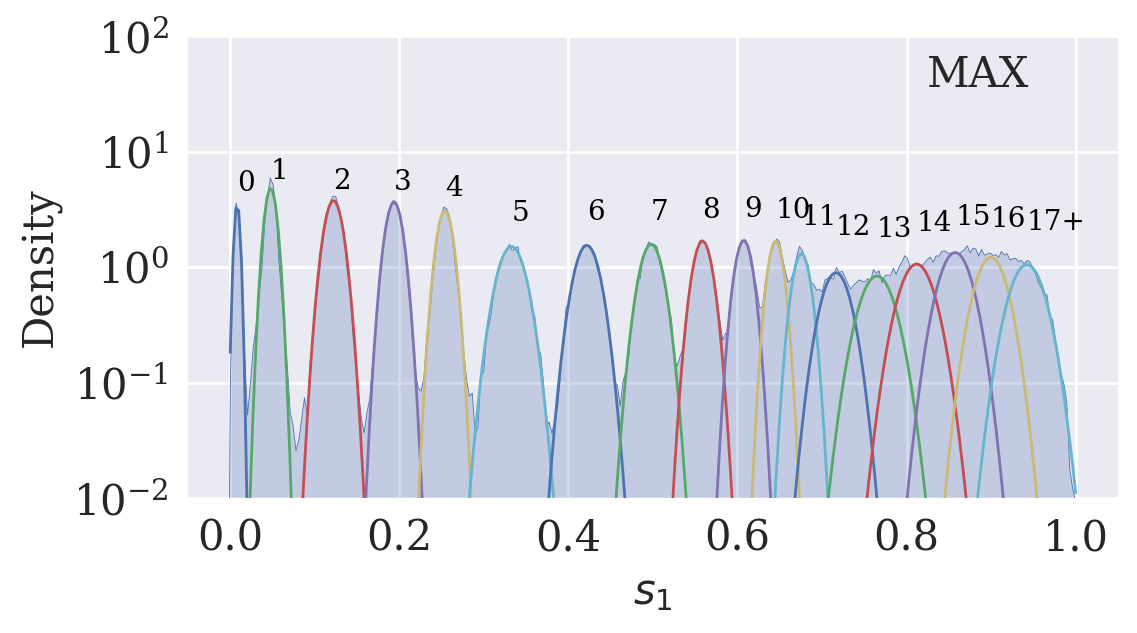
gm.plot_density(
bw_adjust = 0.03,
plot_gaussians = True,
text = name_method,
save_path = PATH_SAVE_D
)
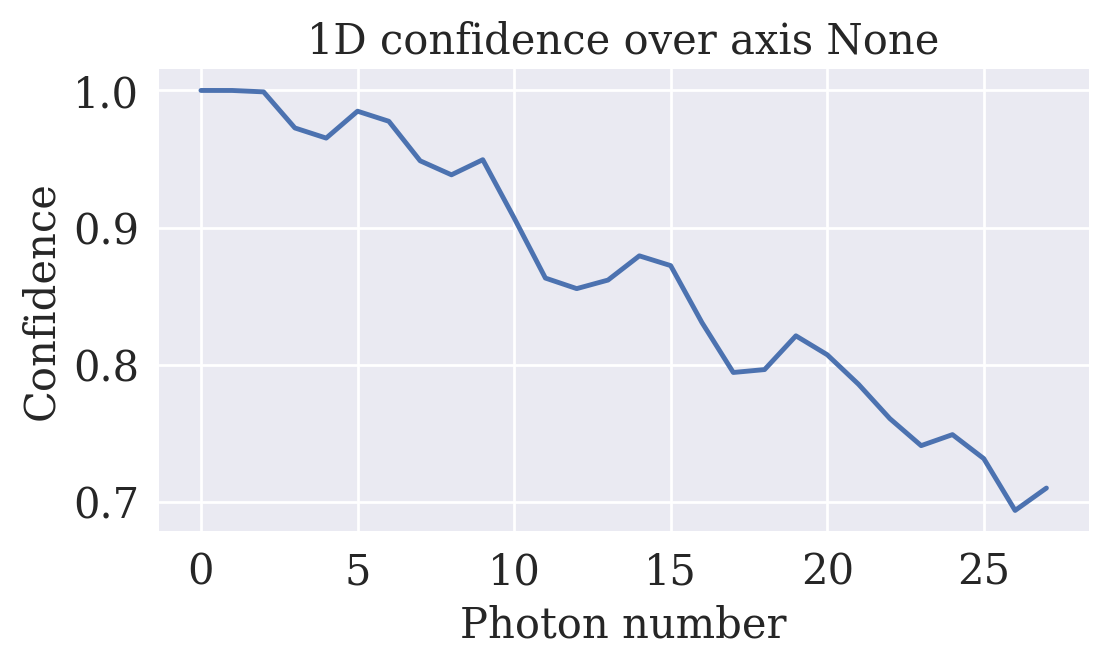
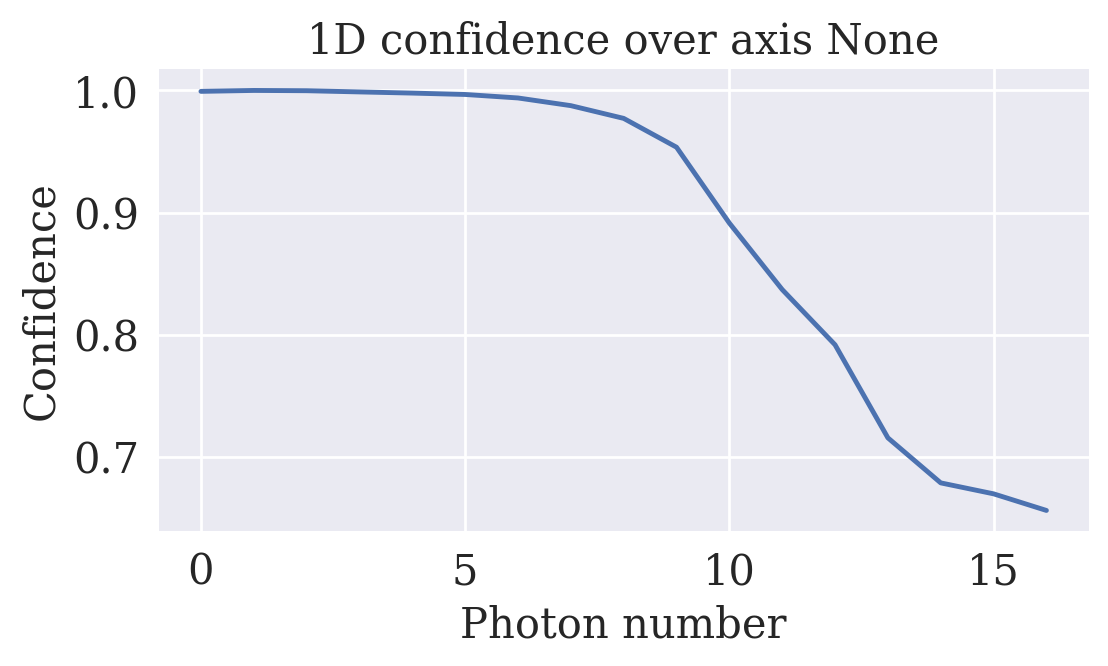
gm.plot_confidence_1d(expected_prob=expected_prob)
save_results(
   gm = gm,
   name_method = name_method,
   path = PATH_RESULTS
)
2.2Area
X_l_AREA  = area(
   X_high = data_test[:,:150],
   filtering = True,
   plot_filter = True,
   threshold = 0.03,
   critical_frequency = 0.1,
   save_path = PATH_SAVE_LD
)
name_method = 'AREA'
gm = gaussian_mixture(
X_low = X_l_AREA,
X_high = data_test,
number_cluster = 34,
cluster_iter = 3,
means_init = get_means(name_method, PATH_INIT_MEANS),
tol = 1e-6,
width_plot=6,
height_plot=3
)
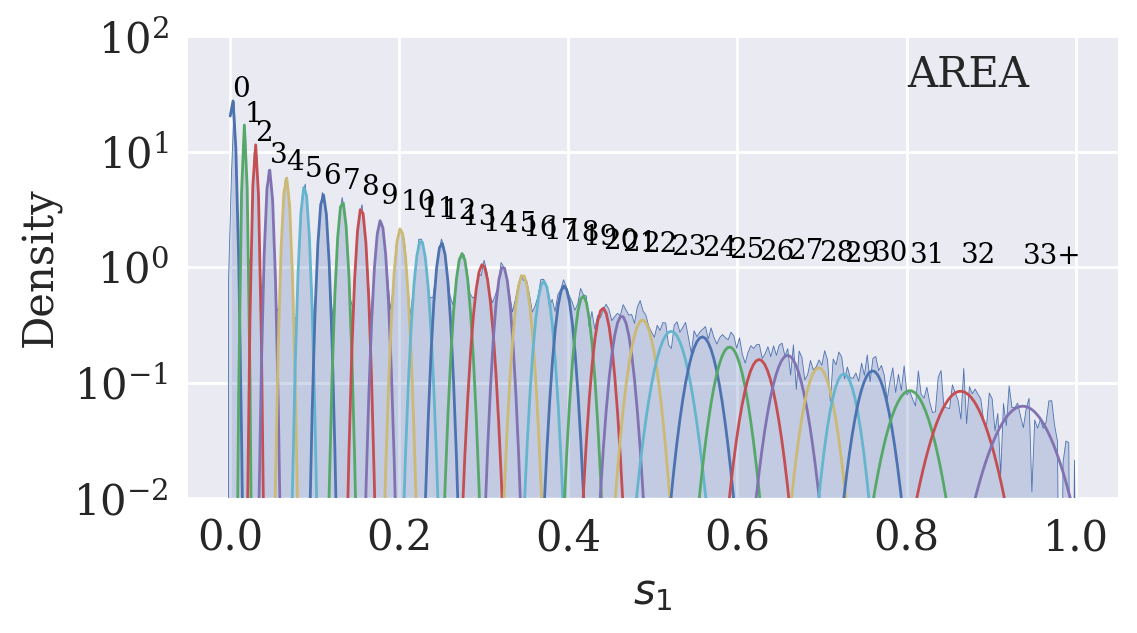
gm.plot_density(
bw_adjust = 0.03,
plot_gaussians = True,
text = name_method,
save_path = PATH_SAVE_D
)
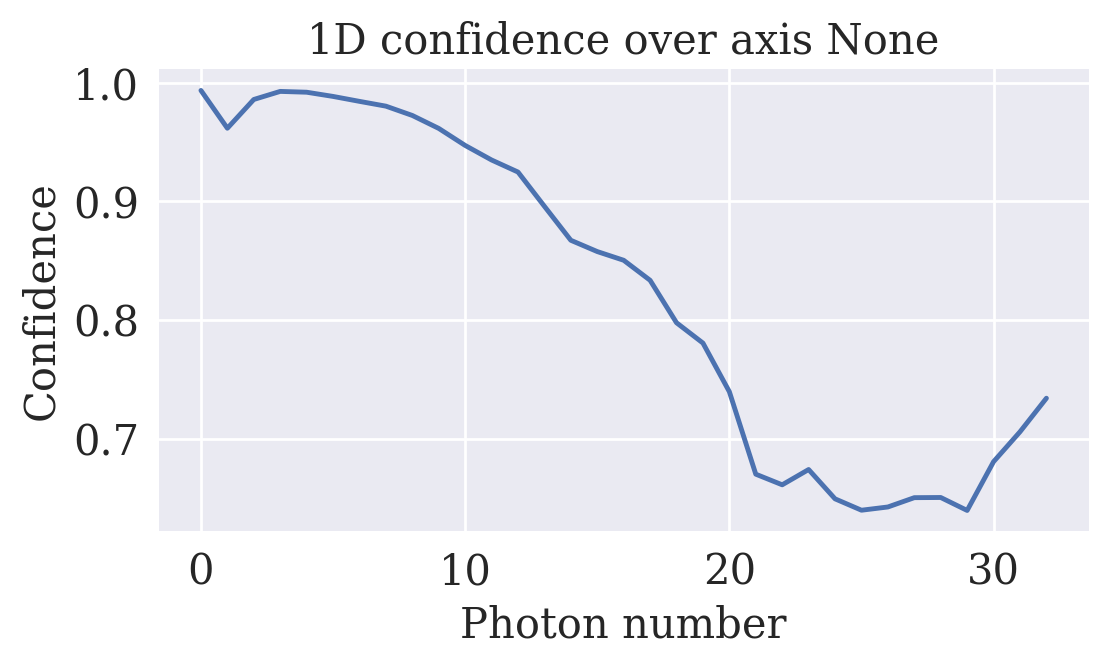
gm.plot_confidence_1d(expected_prob = expected_prob)
save_results(
   gm = gm,
   name_method = name_method,
   path = PATH_RESULTS
)
2.3Principal Component Analysis (PCA)
X_l_PCA = sklearn_available(
   X_train = data_train,
   X_test = data_test,
   path_save = PATH_SAVE_LD,
   function = PCA,
   n_components = 1,
   random_state = 42
)
name_method = 'PCA 1D'
gm = gaussian_mixture(
X_low = X_l_PCA[::SKIP],
X_high = data_test,
number_cluster = 28,
cluster_iter = 5,
means_init = get_means(name_method, PATH_INIT_MEANS),
tol = 1e-6,
info_sweep = 0,
plot_sweep = False,
latex = False
)
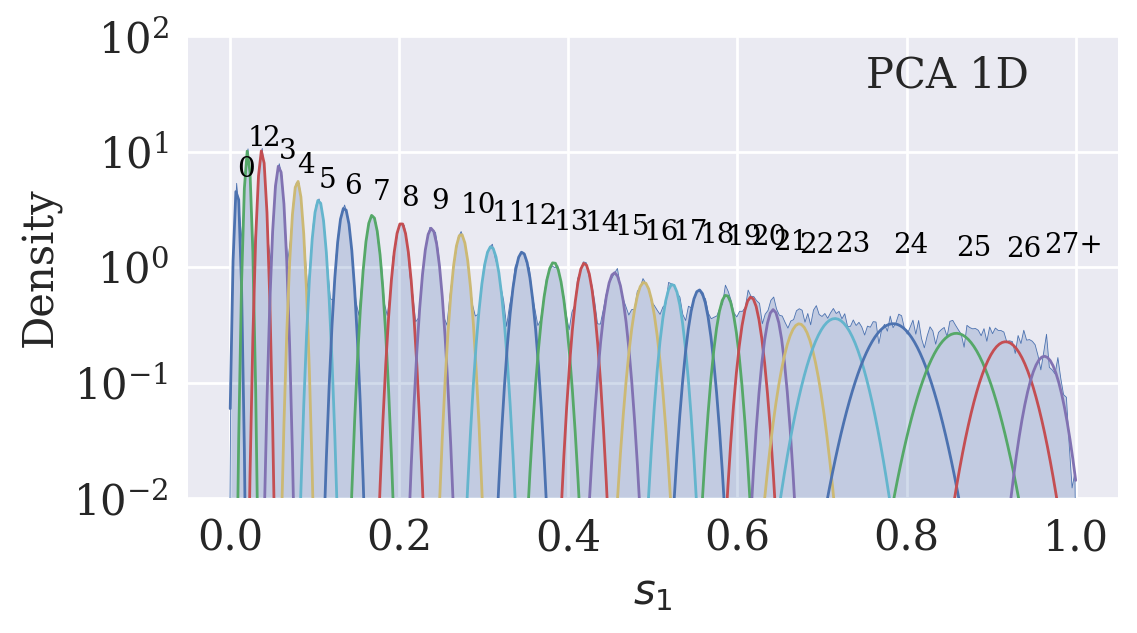
gm.plot_density(
bw_adjust = 0.03,
plot_gaussians = True,
text = name_method,
save_path = PATH_SAVE_D
)
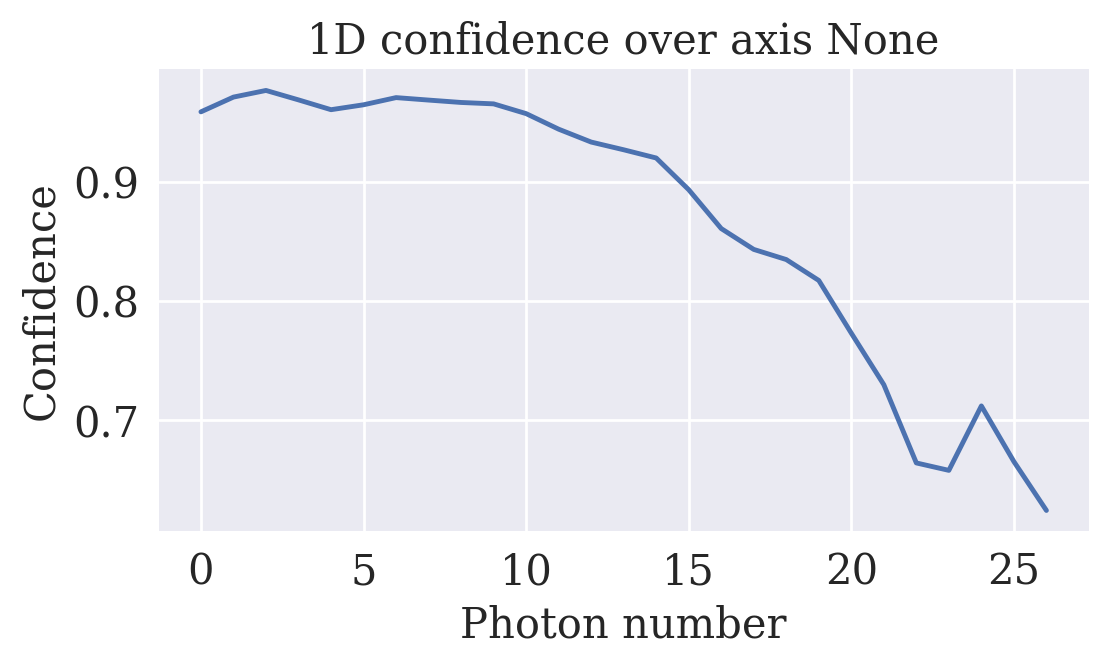
gm.plot_confidence_1d(expected_prob = expected_prob)
save_results(
   gm = gm,
   name_method = name_method,
   path = PATH_RESULTS
)
X_l_PCA = sklearn_available(
   X_train = data_train,
   X_test = data_test,
   path_save = PATH_SAVE_LD,
   function = PCA,
   n_components = 2,
   random_state = 42
)
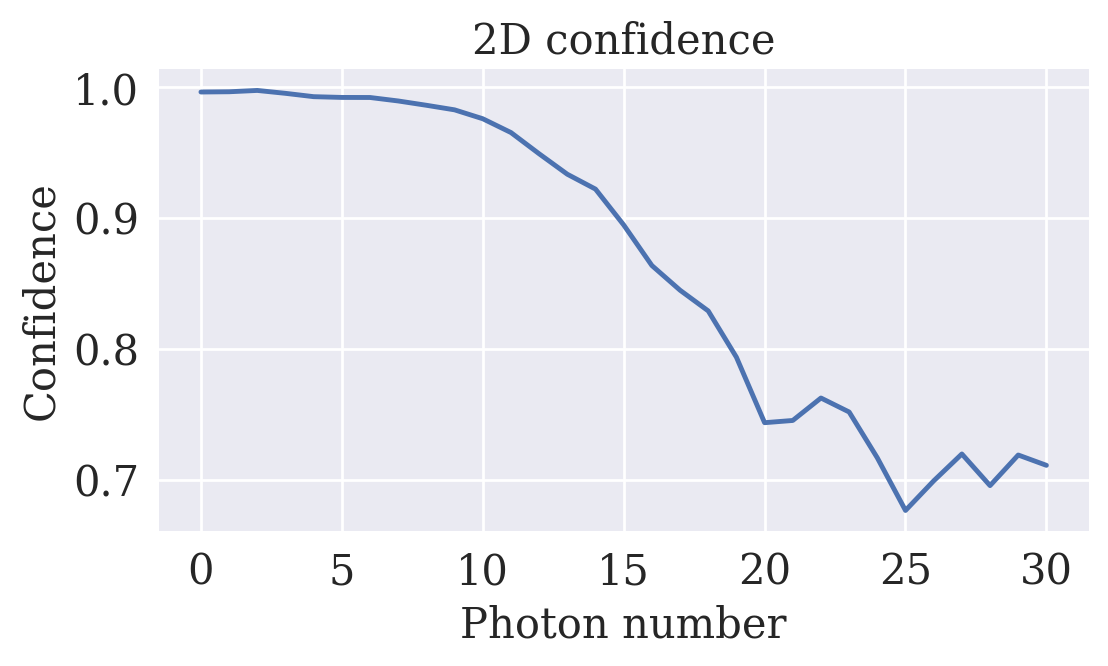
name_method = 'PCA 2D'
gm = gaussian_mixture(
X_low = X_l_PCA[::SKIP],
X_high = data_test,
number_cluster = 32,
cluster_iter = 5,
means_init = get_means(name_method, PATH_INIT_MEANS),
tol = 1e-4,
width_plot=6,
height_plot=6
)
gm.plot_density(
bw_adjust = 0.1,
plot_gaussians = True,
text = name_method,
save_path = PATH_SAVE_D
)/srv/conda/envs/notebook/lib/python3.12/site-packages/seaborn/distributions.py:1176: UserWarning: Log scale: values of z <= 0 have been masked
cset = contour_func(
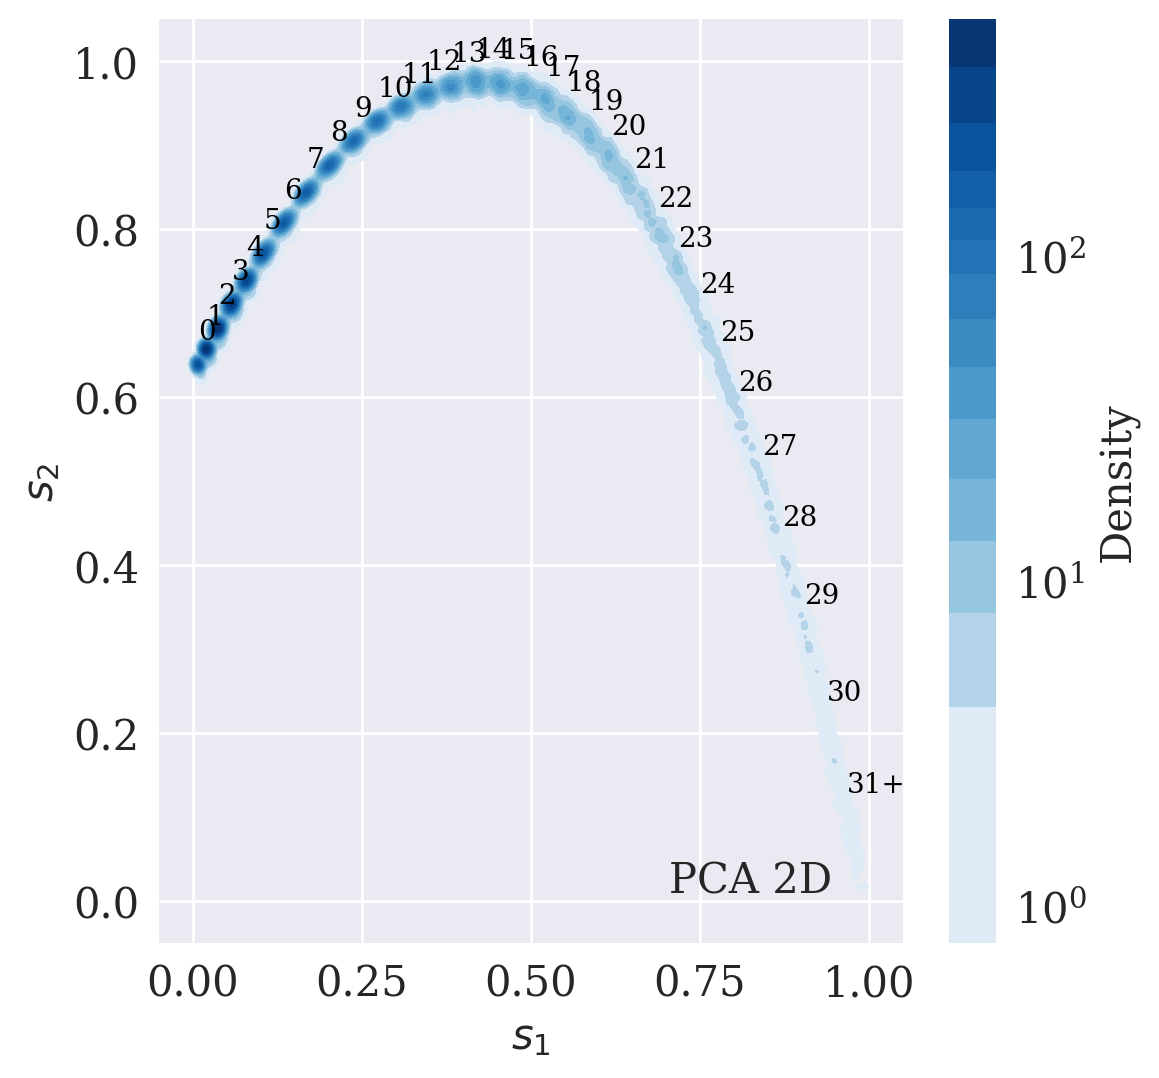
gm.plot_confidence_2d(expected_prob = expected_prob)
save_results(
   gm = gm,
   name_method = name_method,
   path = PATH_RESULTS
)
2.4Kernel PCA (Radial basis function)
X_l_KPCA_RBF = sklearn_available(
   X_train = data_train,
   X_test = data_test,
   path_save = PATH_SAVE_LD,
   function = KernelPCA,
   n_components = 2,
   kernel="rbf",
   gamma = 0.02,
   random_state = 42
)
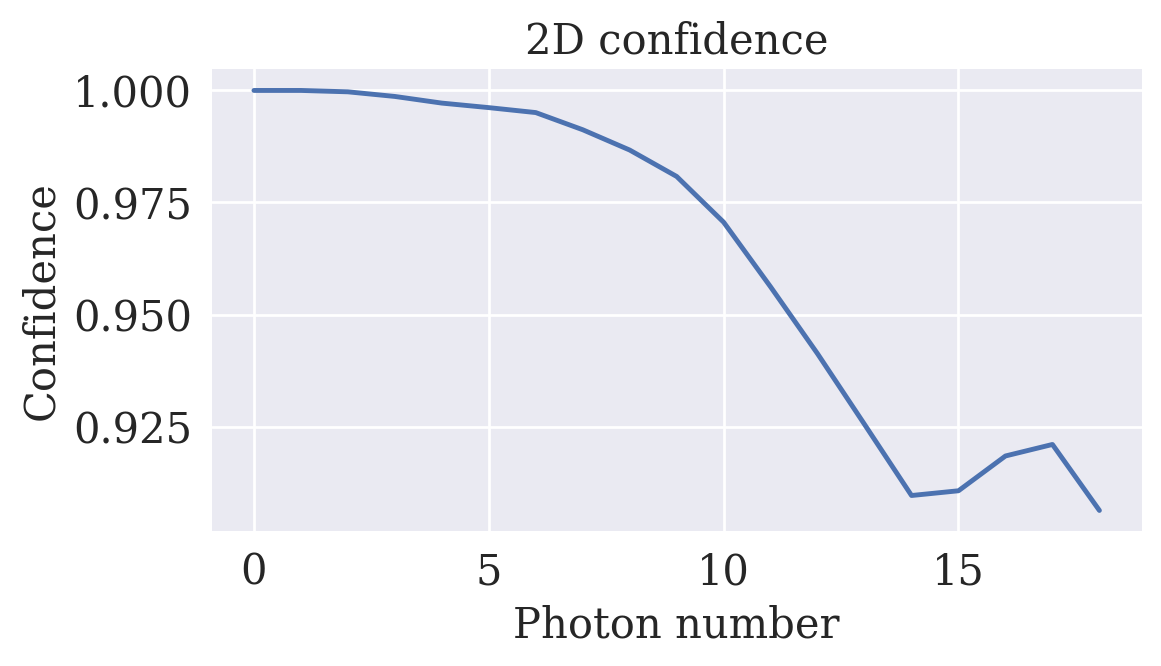
name_method = 'KPCA RBF'
gm = gaussian_mixture(
X_low = X_l_KPCA_RBF[::SKIP],
X_high = data_test,
number_cluster = 20,
cluster_iter = 5,
tol = 1e-4,
means_init = get_means(name_method, PATH_INIT_MEANS),
width_plot = 6,
height_plot = 6
)
gm.plot_density(
bw_adjust = 0.1,
plot_gaussians = True,
text = name_method,
save_path = PATH_SAVE_D
)/srv/conda/envs/notebook/lib/python3.12/site-packages/seaborn/distributions.py:1176: UserWarning: Log scale: values of z <= 0 have been masked
cset = contour_func(
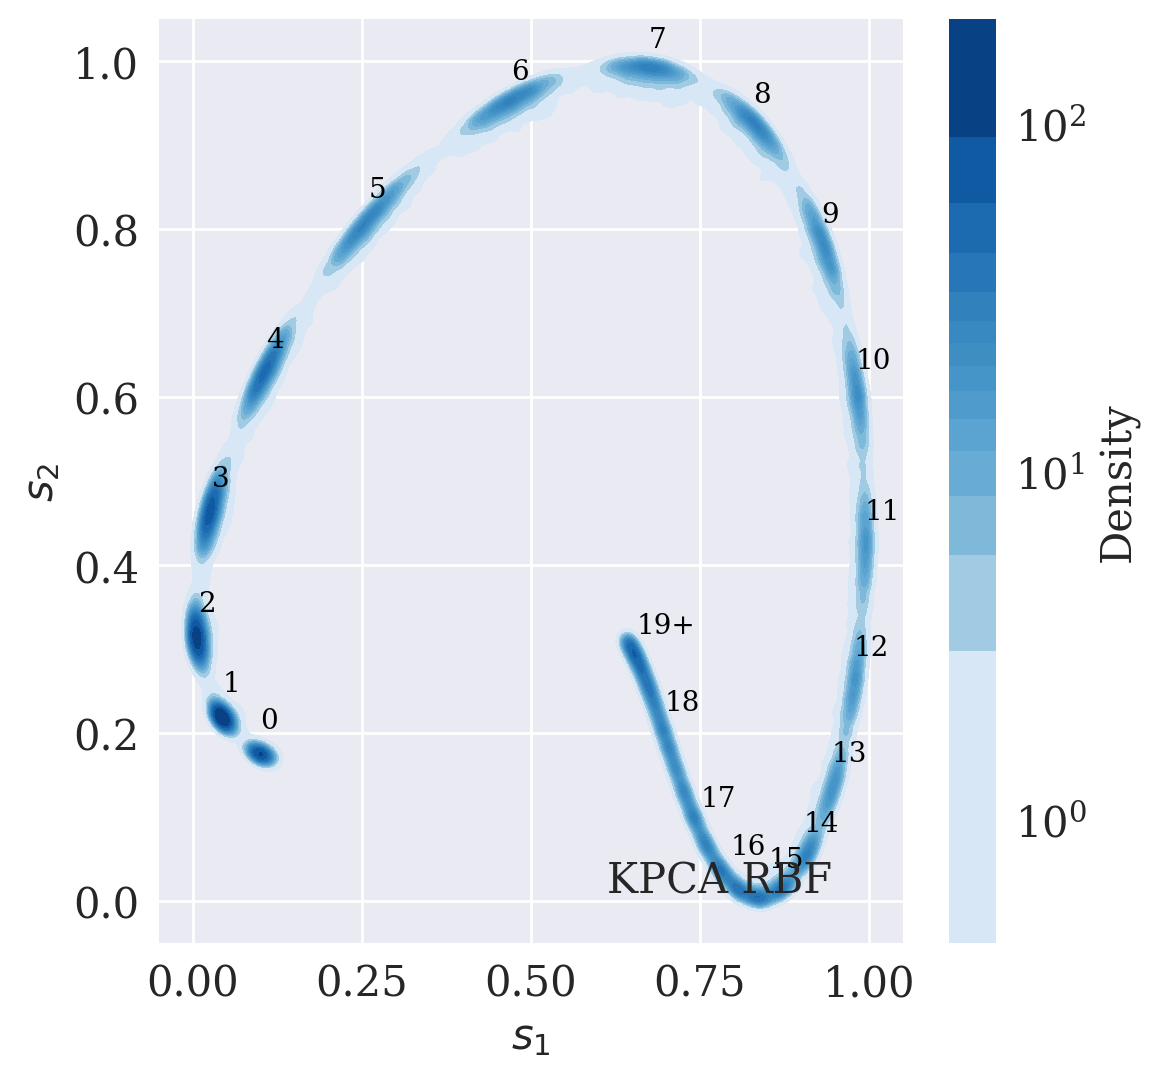
gm.plot_confidence_2d(expected_prob = expected_prob)
save_results(
   gm = gm,
   name_method = name_method,
   path = PATH_RESULTS
)
2.5Kernel PCA (Sigmoid)
X_l_KPCA_S = sklearn_available(
   X_train = data_train,
   X_test = data_test,
   path_save = PATH_SAVE_LD,
   function = KernelPCA,
   n_components = 1,
   kernel = "sigmoid",
   gamma = 0.002,
   random_state = 42
)
name_method = 'KPCA Sig'
gm = gaussian_mixture(
X_low = X_l_KPCA_S[::SKIP],
X_high = data_test,
number_cluster = 27,
cluster_iter = 5,
tol = 1e-4,
means_init = get_means(name_method, PATH_INIT_MEANS),
width_plot = 6,
height_plot = 6
)
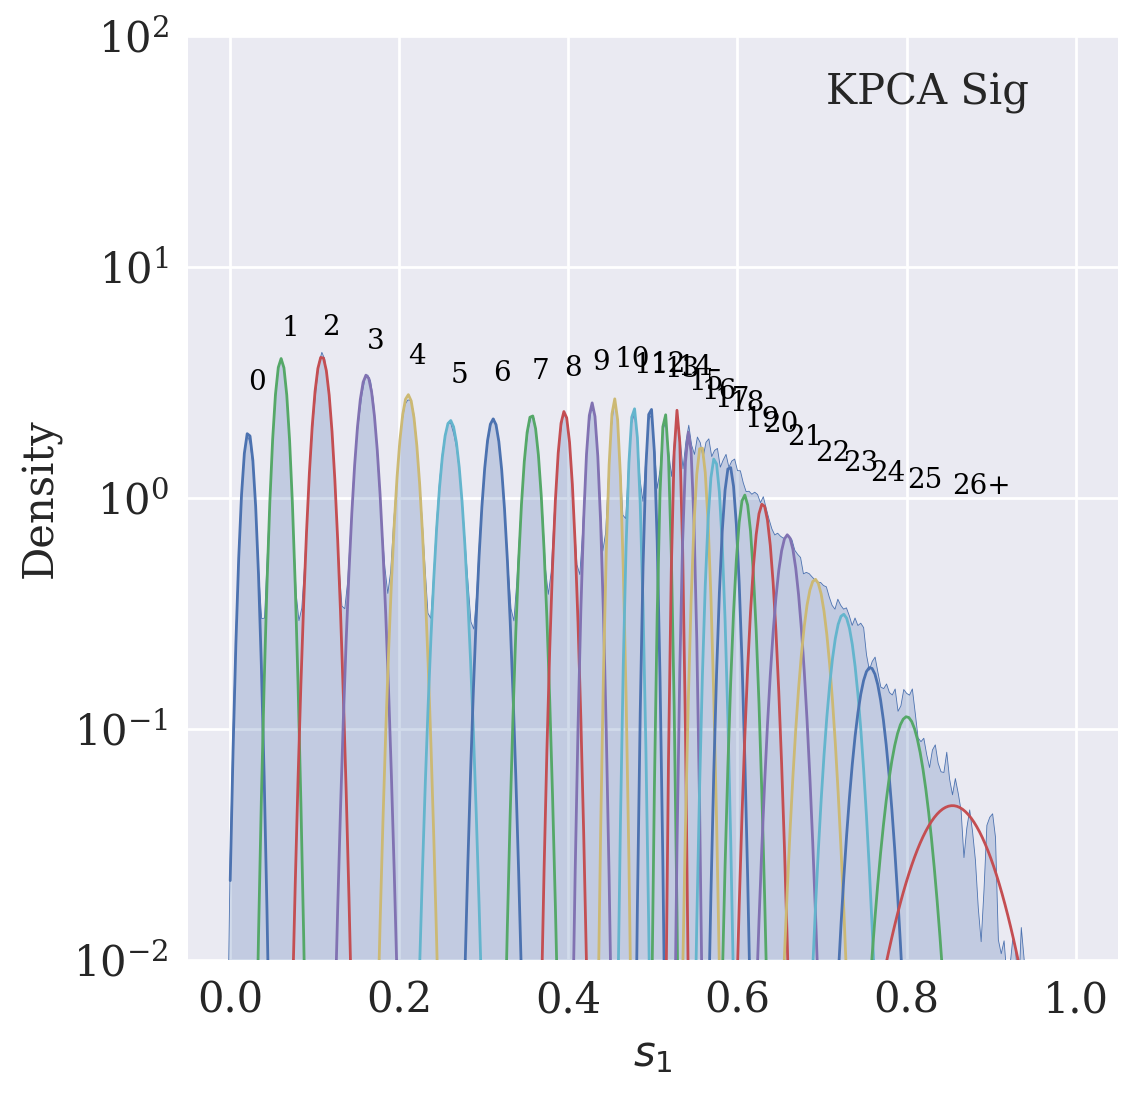
gm.plot_density(
bw_adjust = 0.1,
plot_gaussians = True,
text = name_method,
save_path = PATH_SAVE_D
)
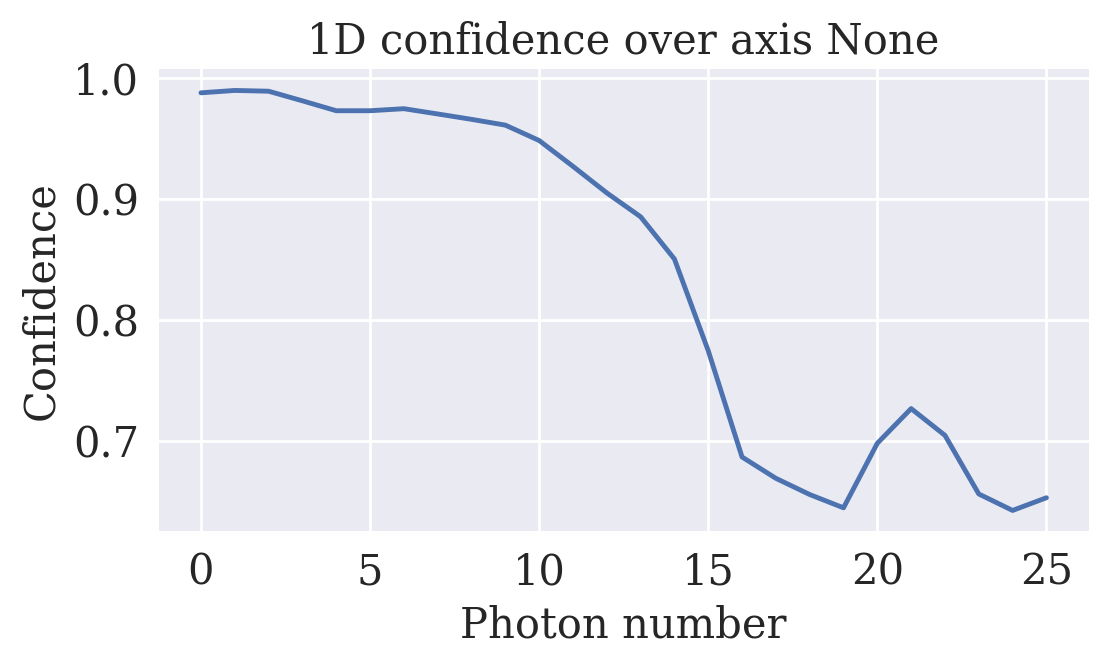
gm.plot_confidence_1d(expected_prob = expected_prob)
save_results(
   gm = gm,
   name_method = name_method,
   path = PATH_RESULTS
)
2.6Kernel PCA (Cosine)
X_l_KPCA_C = sklearn_available(
   X_train = data_train,
   X_test = data_test,
   path_save = PATH_SAVE_LD,
   function = KernelPCA,
   n_components = 2,
   kernel = "cosine",
   gamma = 0.01,
   random_state = 42
)
name_method = 'KPCA Cos'
gm = gaussian_mixture(
X_low = X_l_KPCA_C[::SKIP],
X_high = data_test,
number_cluster = 14,
cluster_iter = 5,
tol = 1e-4,
means_init = get_means(name_method, PATH_INIT_MEANS),
width_plot = 6,
height_plot = 6
)
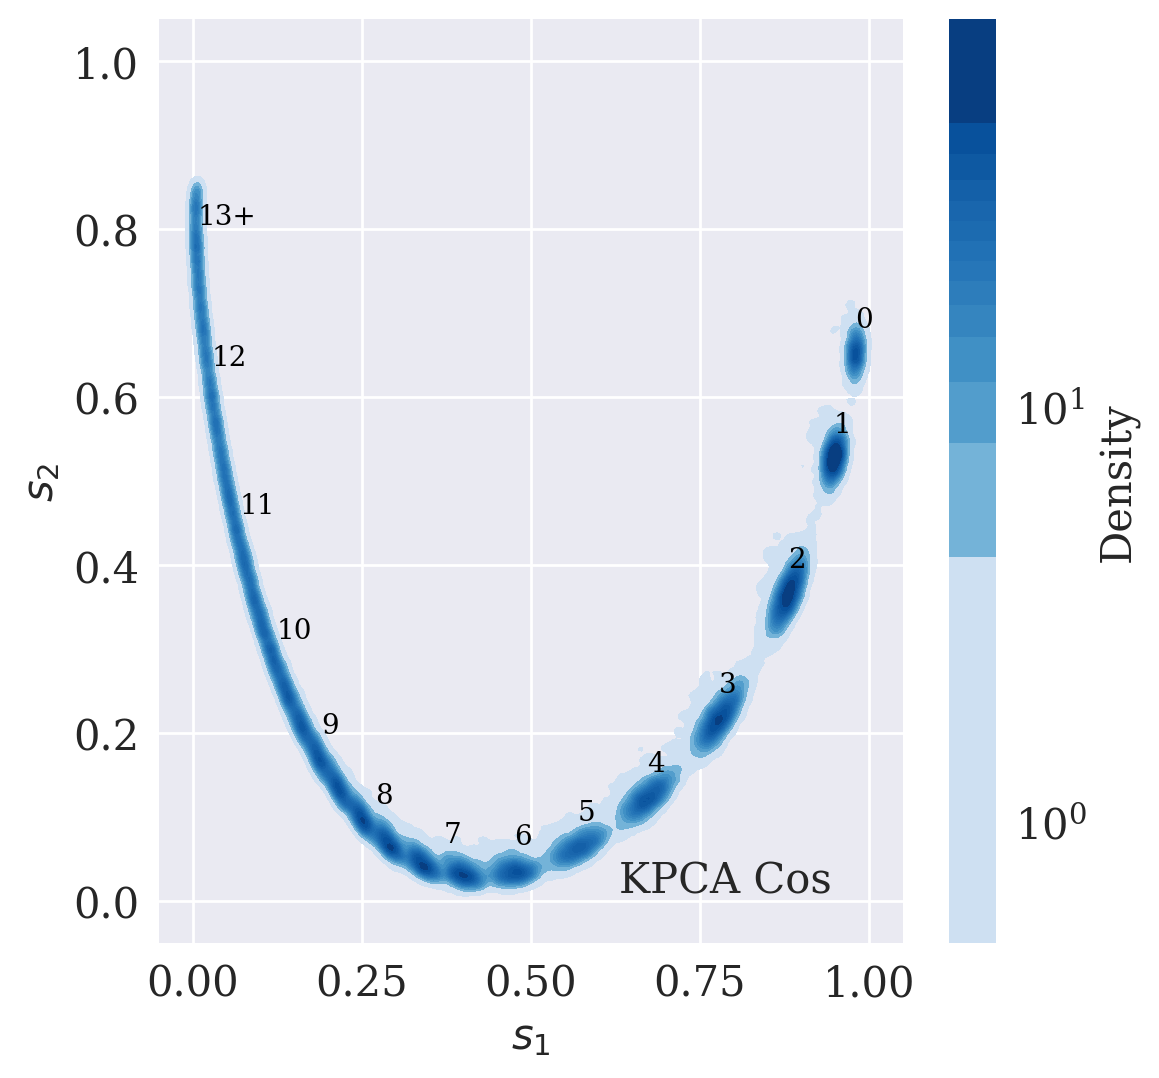
gm.plot_density(
bw_adjust = 0.1,
plot_gaussians = True,
text = name_method,
save_path = PATH_SAVE_D
)/srv/conda/envs/notebook/lib/python3.12/site-packages/seaborn/distributions.py:1176: UserWarning: Log scale: values of z <= 0 have been masked
cset = contour_func(
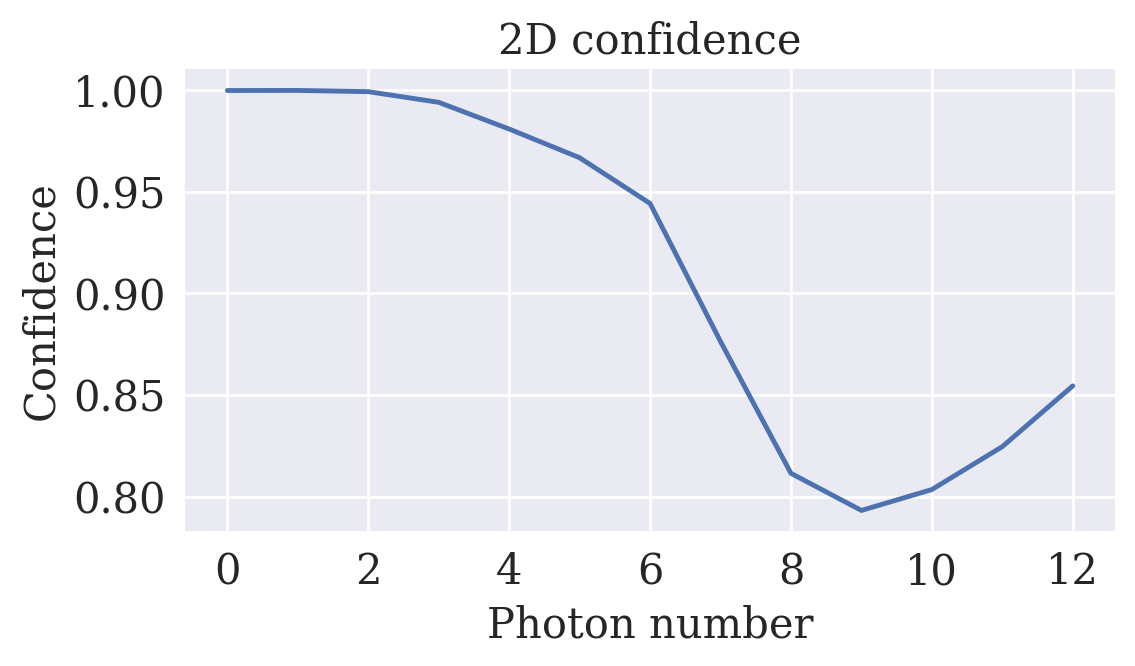
gm.plot_confidence_2d(expected_prob = expected_prob)
save_results(
   gm = gm,
   name_method = name_method,
   path = PATH_RESULTS
)
2.7t-distributed Stochastic Neighbor Embedding (t-SNE)
X_l_tSNE = sklearn_available(
   X_train = data_train,
   X_test = data_test,
   path_save = PATH_SAVE_LD,
   function = TSNE,
   n_components = 2,
   perplexity = 450,
   random_state = 42
)
name_method = 'tSNE 2D'
gm = gaussian_mixture(
X_low = X_l_tSNE[::SKIP],
X_high = data_test,
number_cluster = 29,
cluster_iter = 5,
tol = 1e-4,
means_init = get_means(name_method, PATH_INIT_MEANS),
width_plot = 6,
height_plot = 6
)
gm.plot_density(
bw_adjust = 0.1,
plot_gaussians = True,
text = name_method,
save_path = PATH_SAVE_D
)/srv/conda/envs/notebook/lib/python3.12/site-packages/seaborn/distributions.py:1176: UserWarning: Log scale: values of z <= 0 have been masked
cset = contour_func(
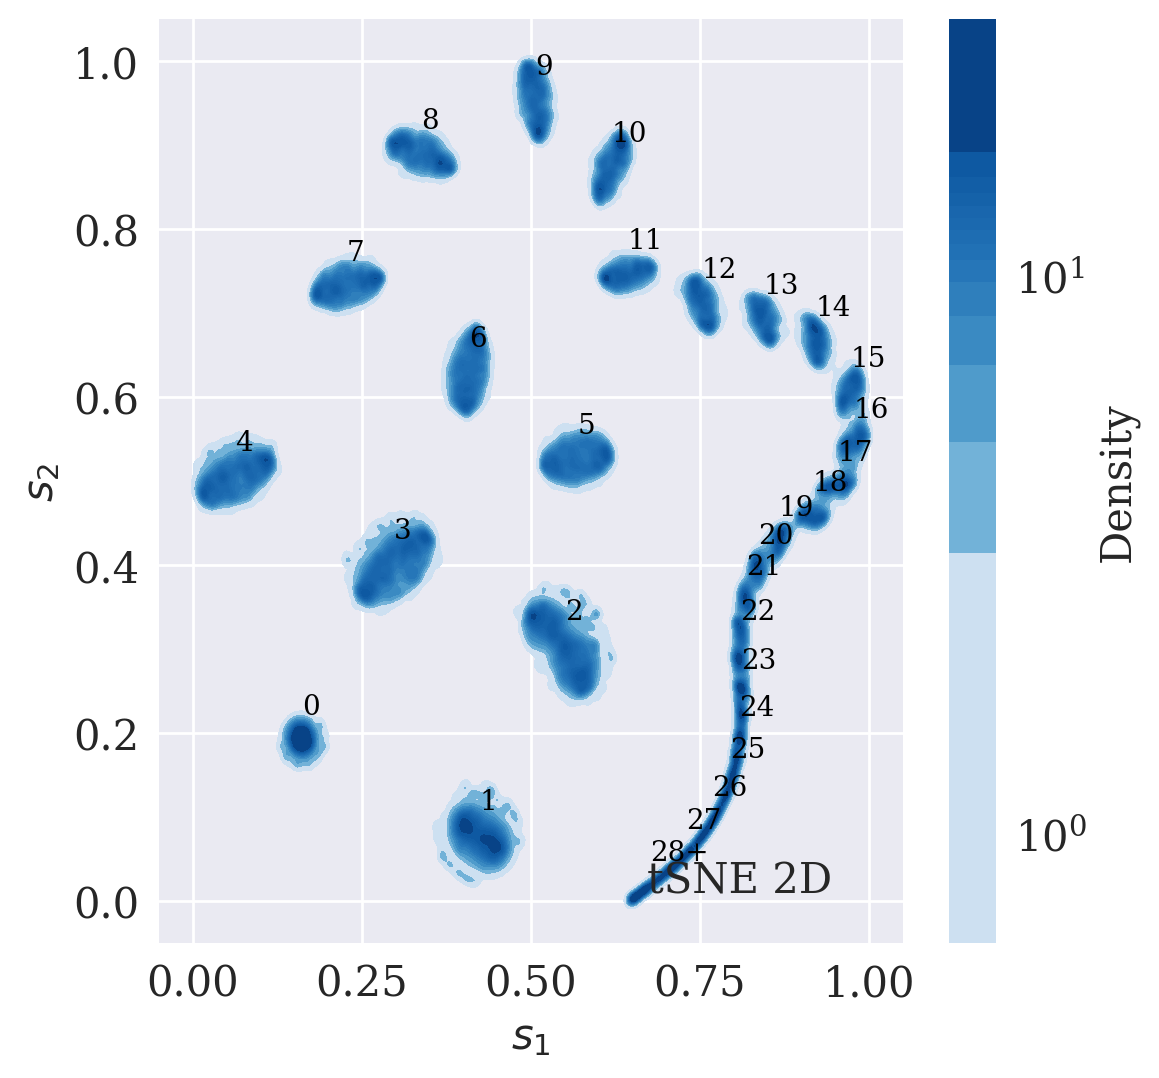
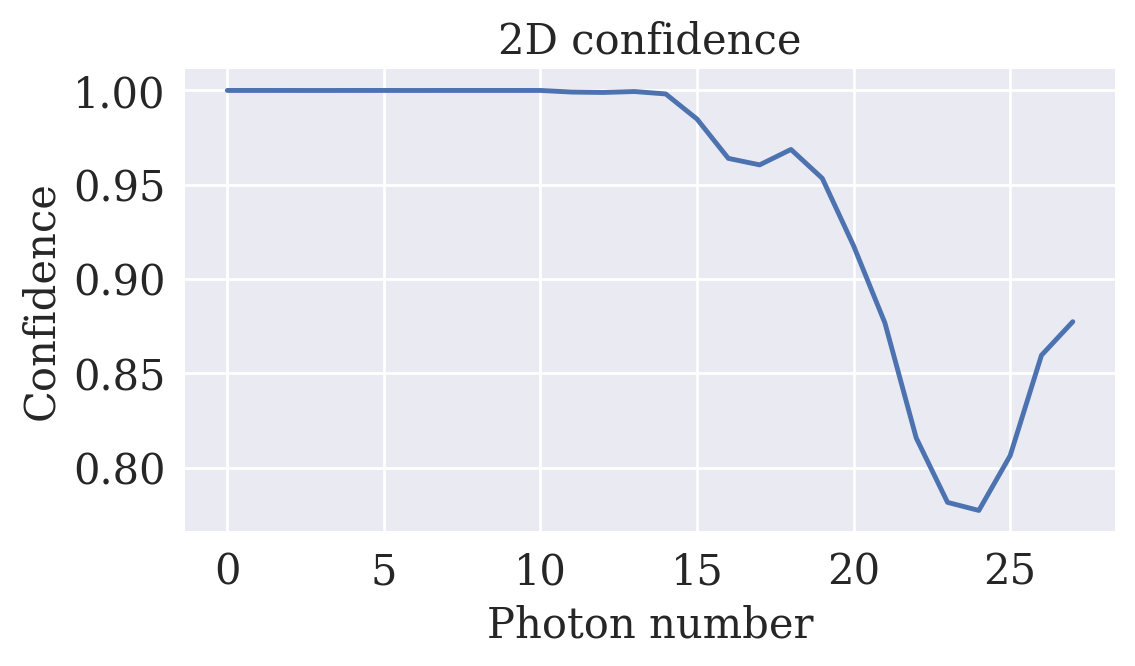
gm.plot_confidence_2d(expected_prob = expected_prob)
save_results(
   gm = gm,
   name_method = name_method,
   path = PATH_RESULTS
)
X_l_tSNE = sklearn_available(
   X_train = data_train,
   X_test = data_test,
   path_save = PATH_SAVE_LD,
   function = TSNE,
   n_components = 1,
   perplexity = 450,
   random_state = 42
)
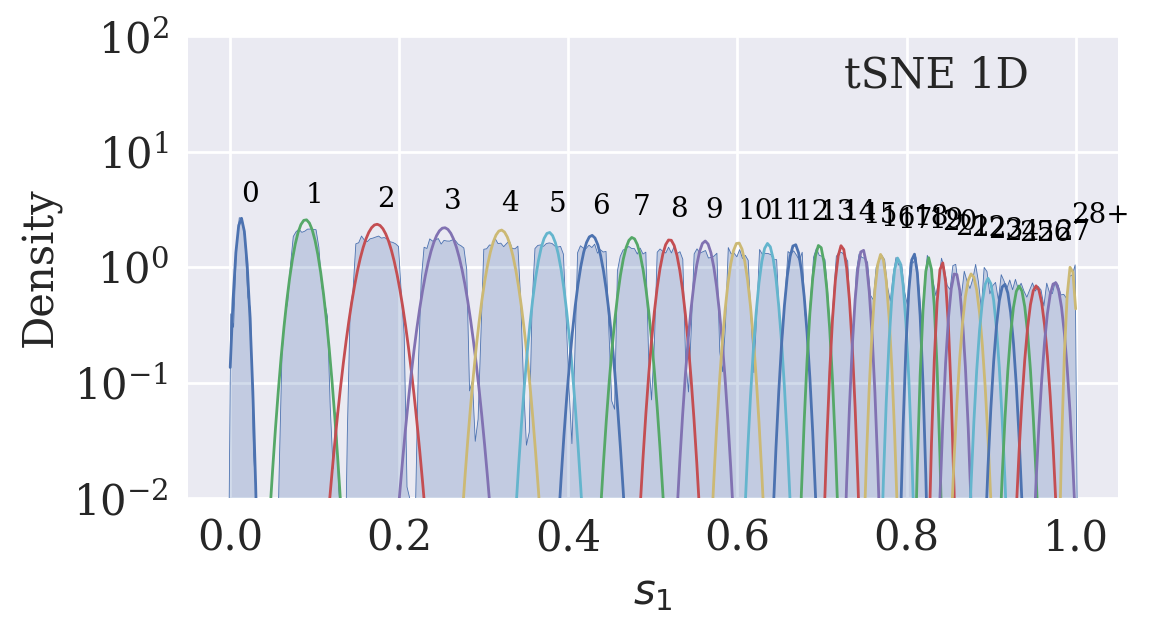
name_method = 'tSNE 1D'
gm = gaussian_mixture(
X_low = X_l_tSNE[::SKIP],
X_high = data_test,
number_cluster = 29,
cluster_iter = 5,
tol = 1e-4,
means_init = get_means(name_method, PATH_INIT_MEANS),
width_plot = 6,
height_plot = 3
)
gm.plot_density(
bw_adjust = 0.03,
plot_gaussians = True,
text = name_method,
save_path = PATH_SAVE_D
)
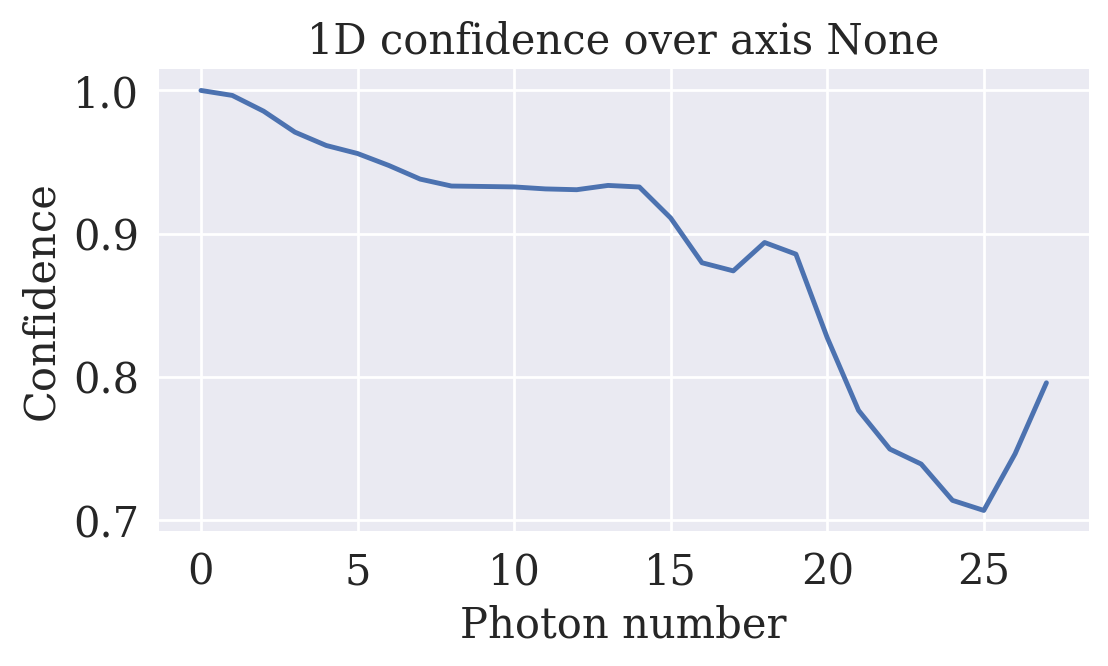
gm.plot_confidence_1d(expected_prob = expected_prob)
save_results(
   gm = gm,
   name_method = name_method,
   path = PATH_RESULTS
)
2.8UMAP
X_l_UMAP = sklearn_available(
   X_train = data_train,
   X_test = data_test,
   path_save = PATH_SAVE_LD+'/umap1d',
   function = umap.UMAP,
   custom_name = '1000.npy',
   n_components = 1,
   n_neighbors = 1000,
   random_state = 42
)
name_method = 'UMAP 1D'
gm = gaussian_mixture(
X_low = X_l_UMAP[::SKIP],
X_high = data_test,
number_cluster = 30,
cluster_iter = 5,
means_init = get_means(name_method, path = PATH_INIT_MEANS),
tol = 1e-8,
width_plot = 6,
height_plot = 3
)
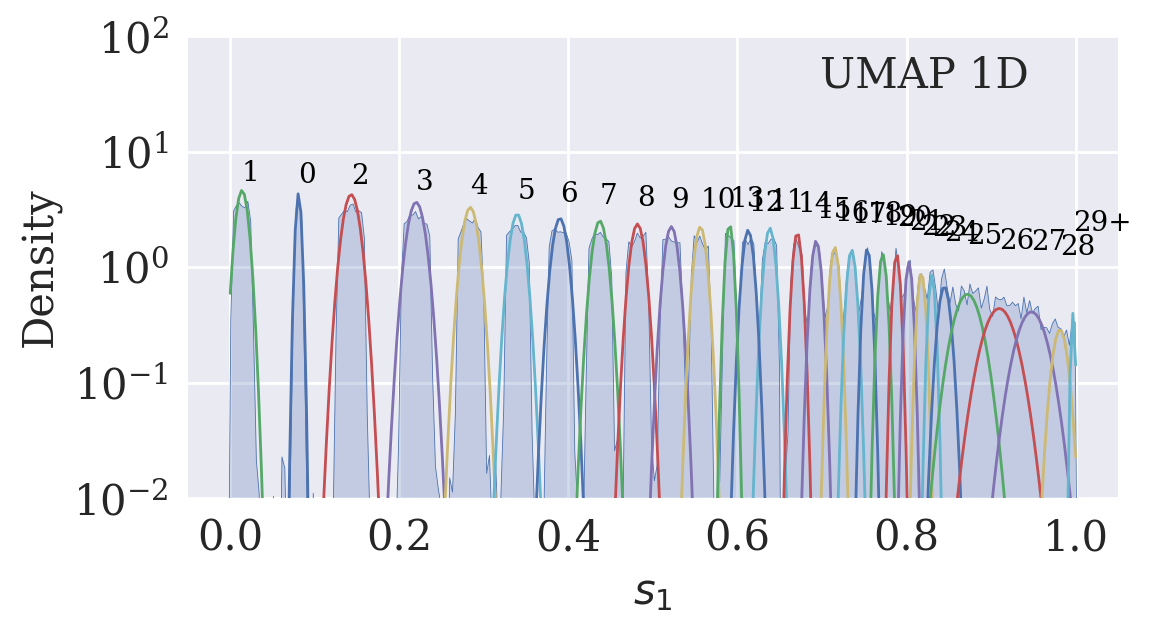
gm.plot_density(
bw_adjust = 0.03,
plot_gaussians = True,
text = name_method,
save_path = PATH_SAVE_D
)
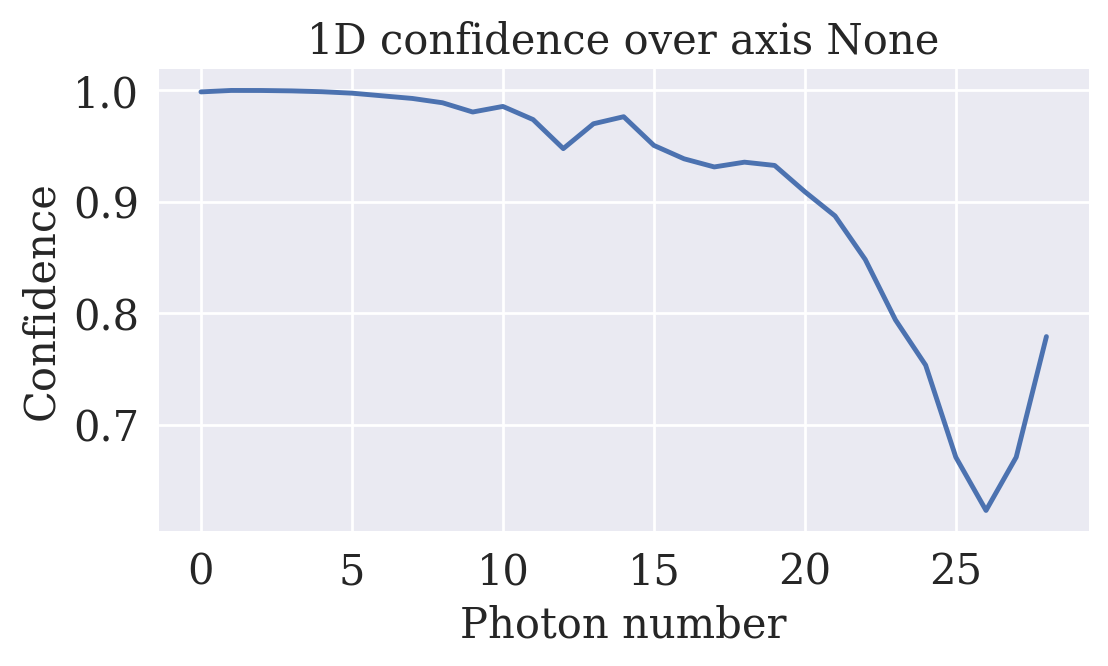
gm.plot_confidence_1d(expected_prob = expected_prob)
save_results(
   gm = gm,
   name_method = name_method,
   path = PATH_RESULTS
)
X_l_UMAP = sklearn_available(
   X_train = data_train,
   X_test = data_test,
   path_save = PATH_SAVE_LD+'/umap2d',
   function = umap.UMAP,
   custom_name = '700.npy',
   n_components = 2,
   n_neighbors = 700,
   random_state = 42
)
name_method = 'UMAP 2D'
gm = gaussian_mixture(
X_low = X_l_UMAP[::SKIP],
X_high = data_test,
number_cluster = 31,
cluster_iter = 5,
means_init = get_means(name_method, path = PATH_INIT_MEANS),
tol = 1e-6,
width_plot = 6,
height_plot = 6
)
gm.plot_density(
bw_adjust = 0.1,
plot_gaussians = True,
text = name_method,
save_path = PATH_SAVE_D
)/srv/conda/envs/notebook/lib/python3.12/site-packages/seaborn/distributions.py:1176: UserWarning: Log scale: values of z <= 0 have been masked
cset = contour_func(
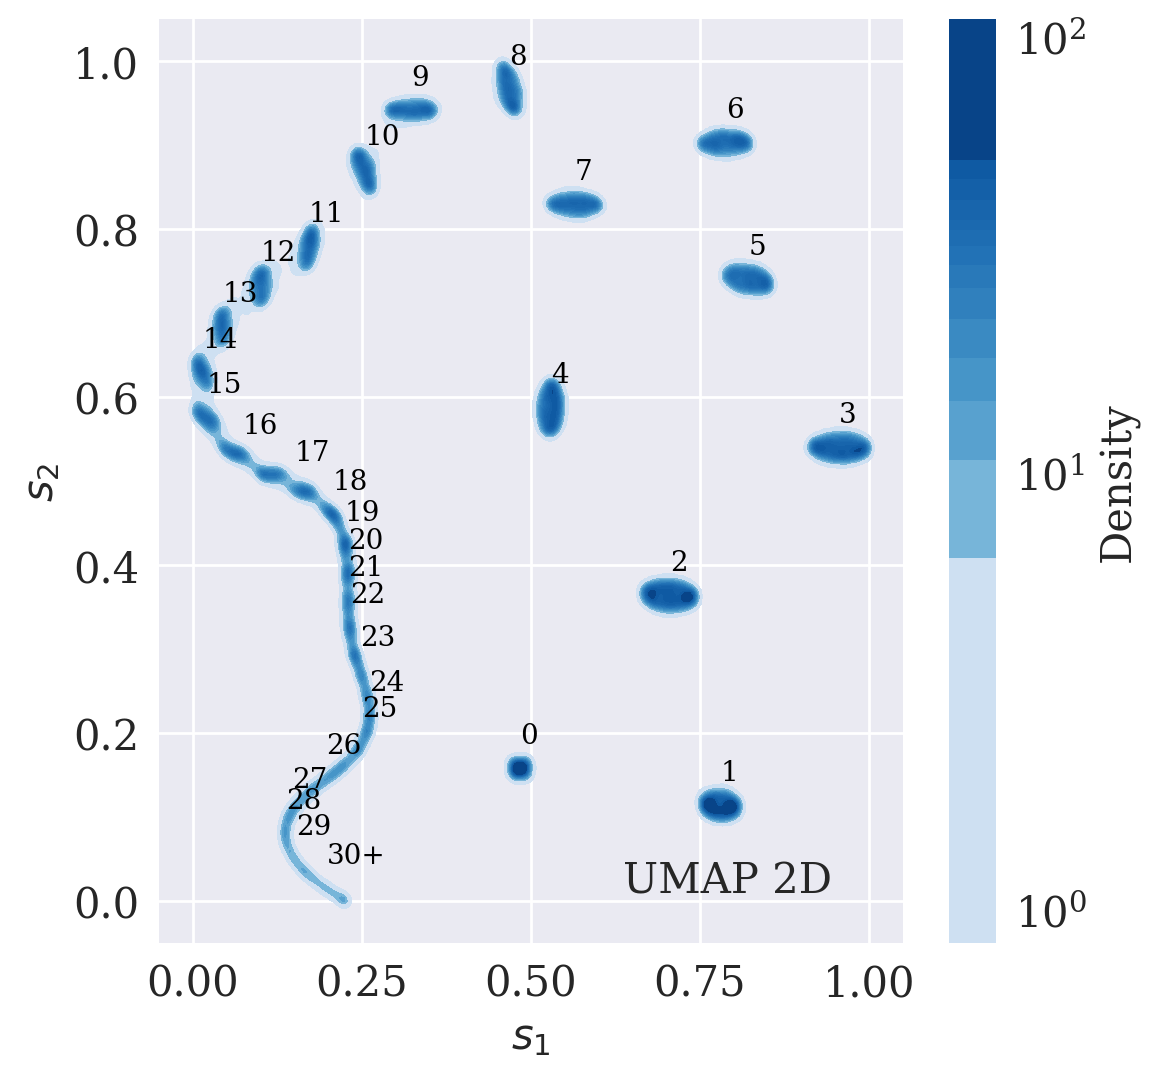
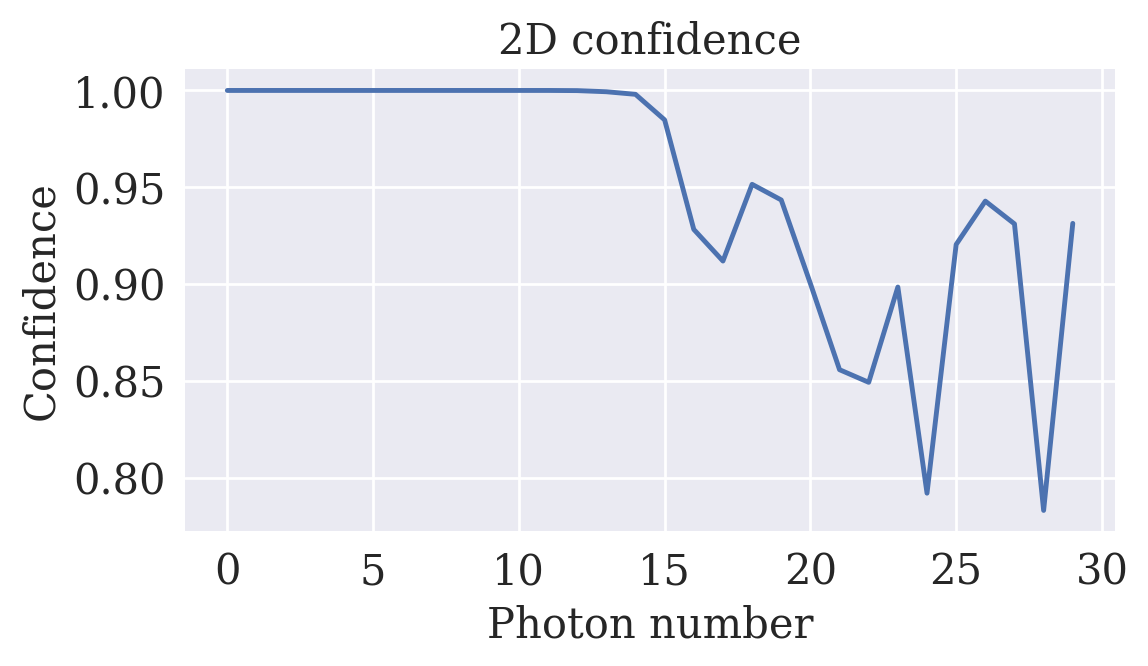
gm.plot_confidence_2d(expected_prob = expected_prob)
save_results(
   gm = gm,
   name_method = name_method,
   path = PATH_RESULTS
)
2.9Non-Negative Matrix Factorization (NMF)
X_l_NMF = sklearn_available(
   X_train = 1+data_train,
   X_test = 1+data_test,
   path_save = PATH_SAVE_LD,
   function = NMF,
   n_components = 1,
   max_iter = 400,
   solver = 'mu',
   beta_loss = 'kullback-leibler',
   tol = 1e-10,
   random_state = 42
)
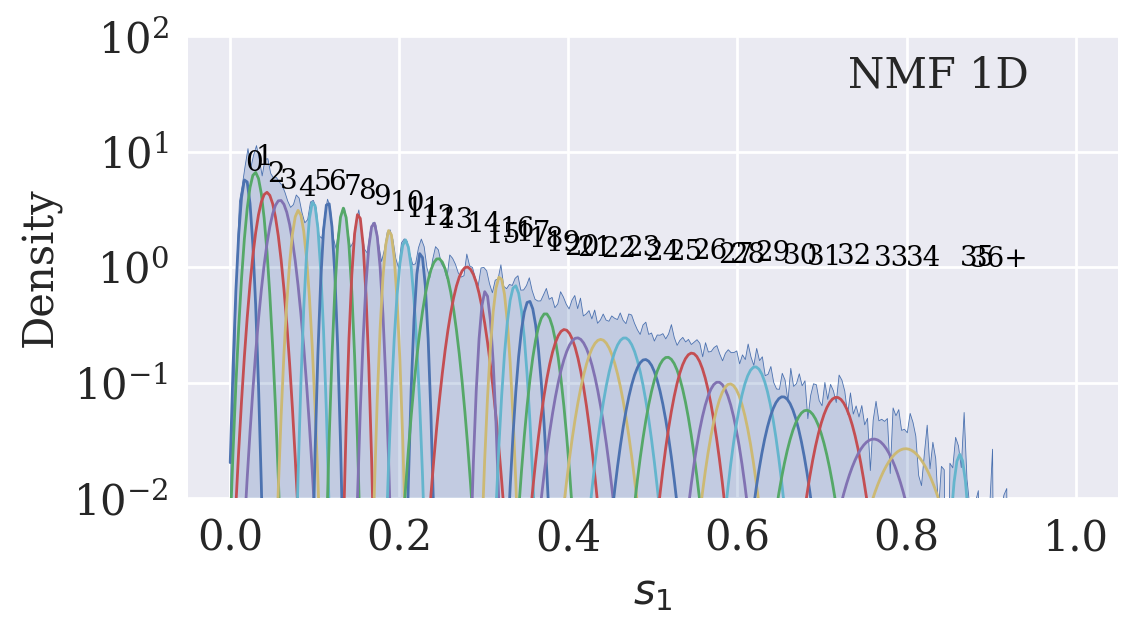
name_method = 'NMF 1D'
gm = gaussian_mixture(
X_low = X_l_NMF[::SKIP],
X_high = data_test,
number_cluster = 37,
cluster_iter = 5,
means_init = get_means(name_method, path = PATH_INIT_MEANS),
tol = 1e-8,
width_plot = 6,
height_plot = 3
)
gm.plot_density(
bw_adjust = 0.05,
plot_gaussians = True,
text = name_method,
save_path = PATH_SAVE_D
)/srv/conda/envs/notebook/lib/python3.12/site-packages/sklearn/mixture/_base.py:293: ConvergenceWarning: Best performing initialization did not converge. Try different init parameters, or increase max_iter, tol, or check for degenerate data.
warnings.warn(
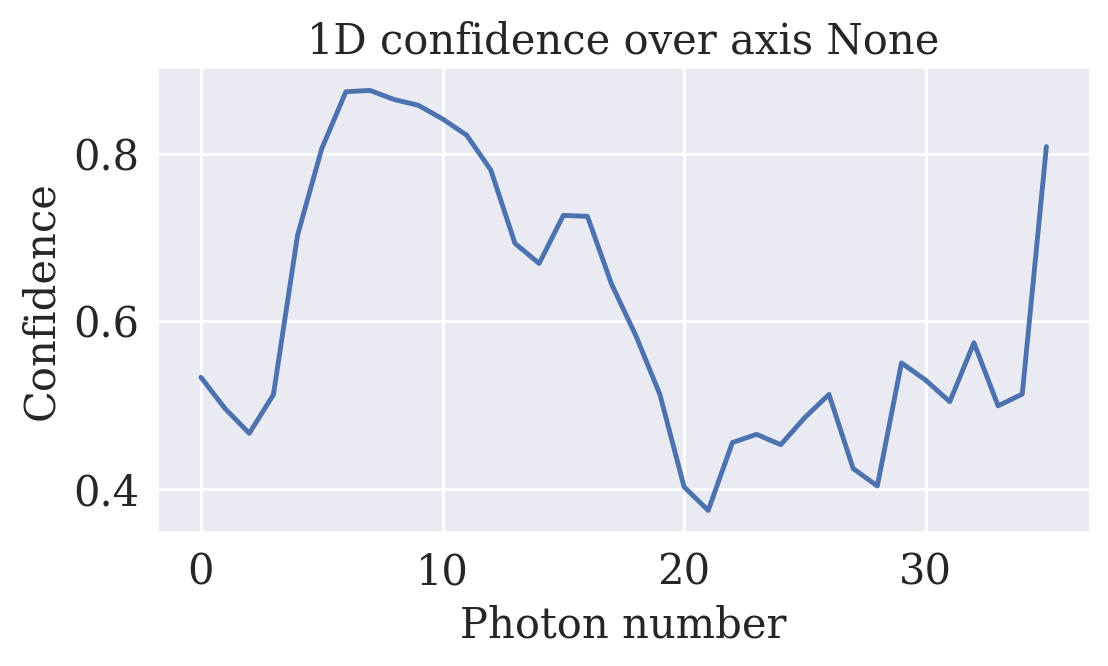
gm.plot_confidence_1d(expected_prob = expected_prob)
save_results(
   gm = gm,
   name_method = name_method,
   path = PATH_RESULTS
)
2.10Isomap
X_l_ISO = sklearn_available(
   X_train = data_train,
   X_test = data_test,
   path_save = PATH_SAVE_LD,
   function = Isomap,
   n_neighbors = 15,
   n_components = 1,
   eigen_solver = "arpack"
)
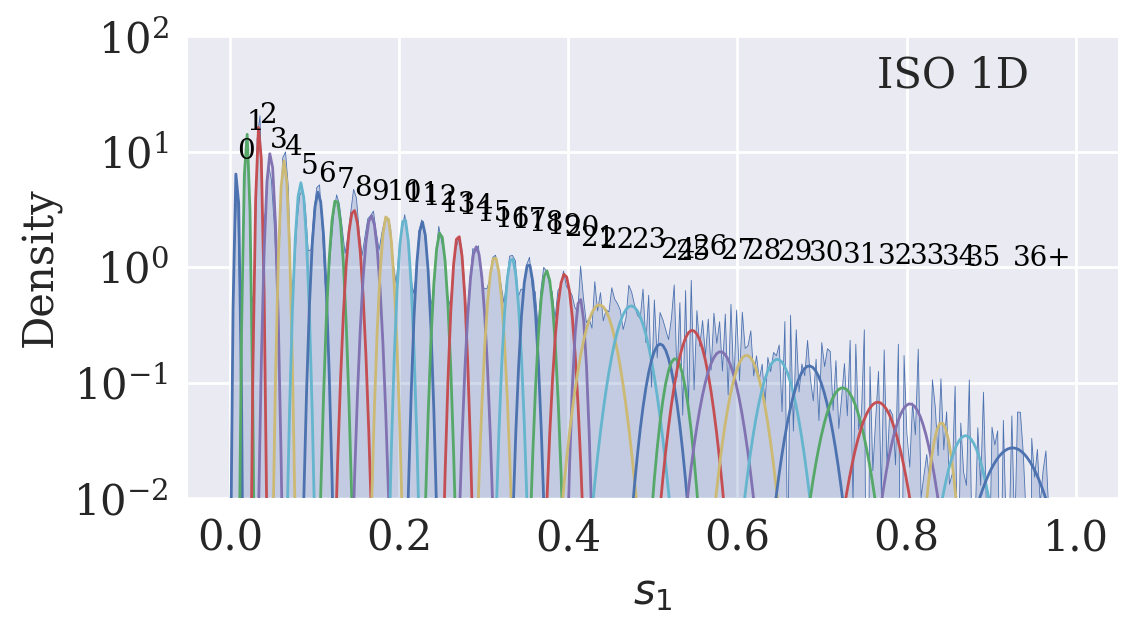
name_method = 'ISO 1D'
gm = gaussian_mixture(
X_low = X_l_ISO[::SKIP],
X_high = data_test,
number_cluster = 37,
cluster_iter = 5,
means_init = get_means(name_method, path = PATH_INIT_MEANS),
tol = 1e-8,
width_plot = 6,
height_plot = 3
)
gm.plot_density(
bw_adjust = 0.03,
plot_gaussians = True,
text = name_method,
save_path = PATH_SAVE_D
)
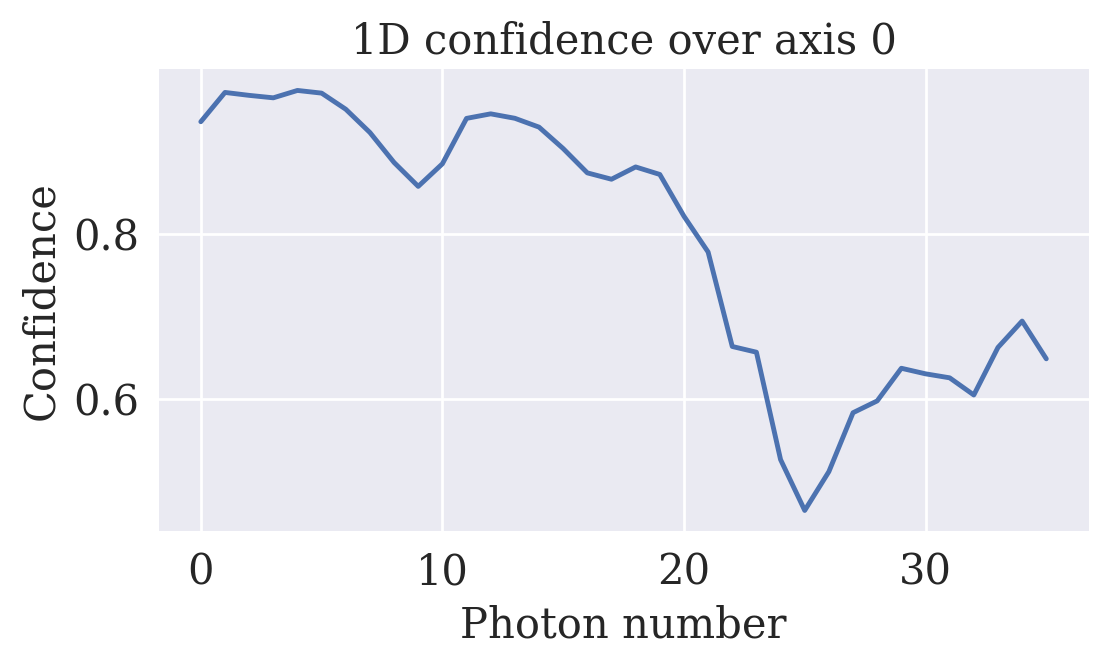
gm.plot_confidence_1d(expected_prob = expected_prob, axis=0)
save_results(
   gm = gm,
   name_method = name_method,
   path = PATH_RESULTS
)
2.11Parametric t-SNE
model = load_model(Network, f'src/Parametric_TSNE/model 1D').to(device='cpu')

data_test_ = torch.from_numpy(data_test).float().view(-1, 350).to(device='cpu')
data_test_ = (data_test_ - data_test_.min()) / (data_test_.max() - data_test_.min())

with torch.no_grad():
    X_l_PTSNE = model(data_test_, encode = True).cpu().numpy()
name_method = 'PTSNE 1D'
gm = gaussian_mixture(
X_low = X_l_PTSNE,
X_high = data_test,
number_cluster = 24,
cluster_iter = 5,
means_init = get_means(name_method, path = PATH_INIT_MEANS),
tol = 1e-4,
width_plot = 6,
height_plot = 3
)
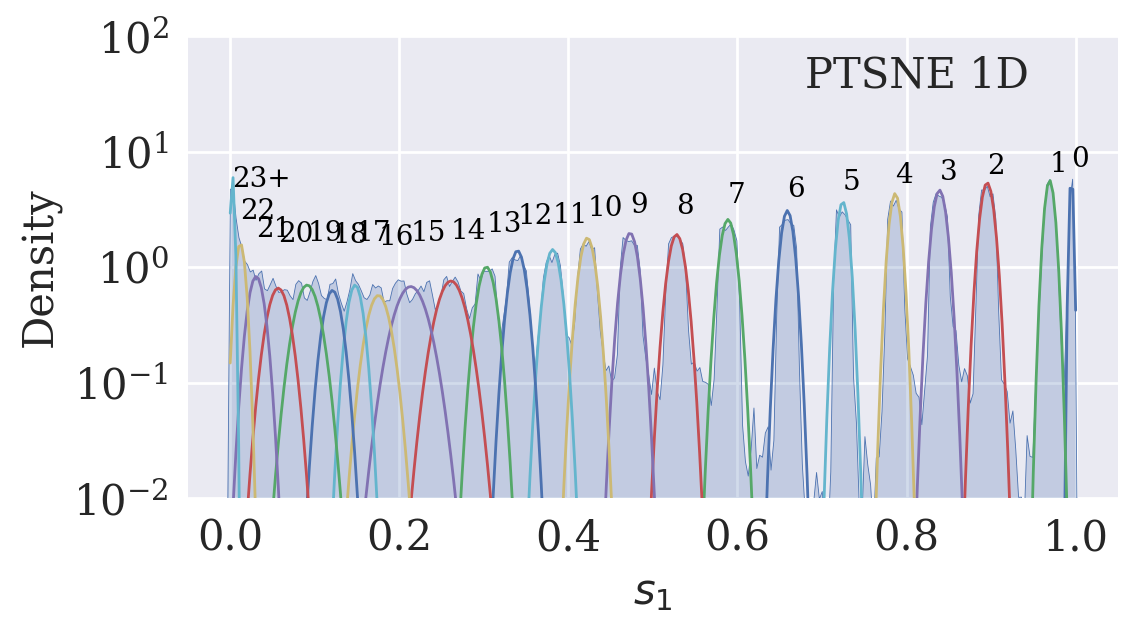
gm.plot_density(
bw_adjust = 0.03,
plot_gaussians = True,
text = name_method,
save_path = PATH_SAVE_D
)
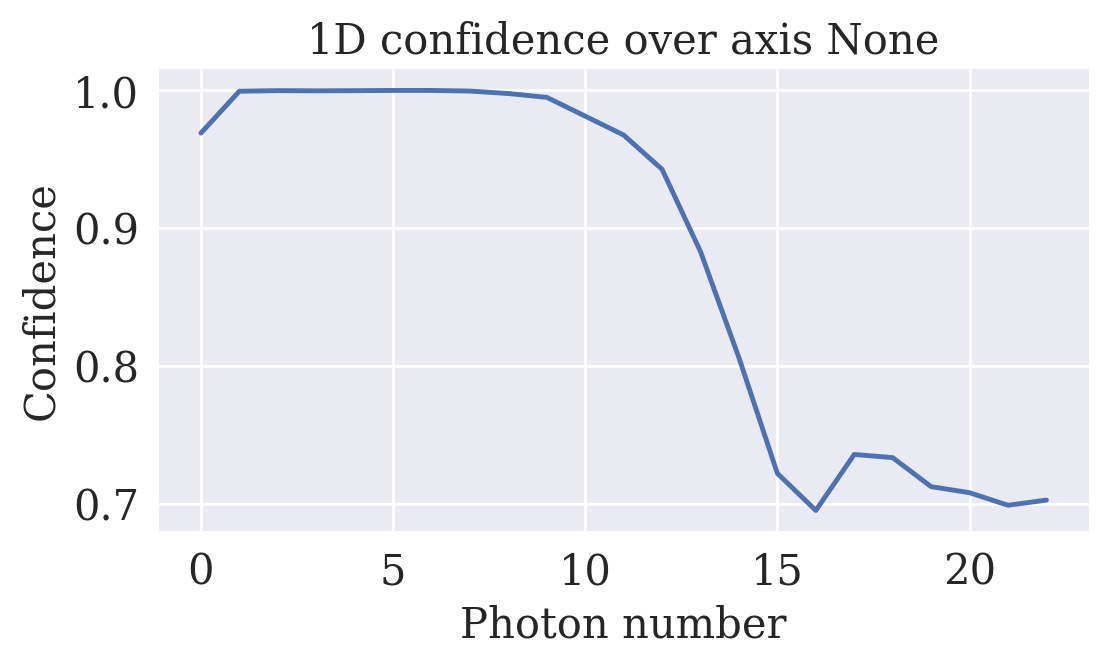
gm.plot_confidence_1d(expected_prob = expected_prob)
save_results(
   gm = gm,
   name_method = name_method,
   path = PATH_RESULTS
)
2.12Parametric UMAP
model = load_pumap('src/Parametric_UMAP/model 1D/model.ckpt').to('cpu')
X_PUMAP = model.encoder(torch.from_numpy(data_test).view(-1,350).to(dtype=torch.float)).detach().numpy()
/srv/conda/envs/notebook/lib/python3.12/site-packages/pytorch_lightning/utilities/parsing.py:208: Attribute 'encoder' is an instance of `nn.Module` and is already saved during checkpointing. It is recommended to ignore them using `self.save_hyperparameters(ignore=['encoder'])`.
name_method = 'PUMAP 1D'
gm = gaussian_mixture(
   X_low = -X_PUMAP,
   X_high = data_test,
   number_cluster = 29,
   cluster_iter = 5,
   means_init = get_means(name_method, path = PATH_INIT_MEANS),
   tol = 1e-4
)

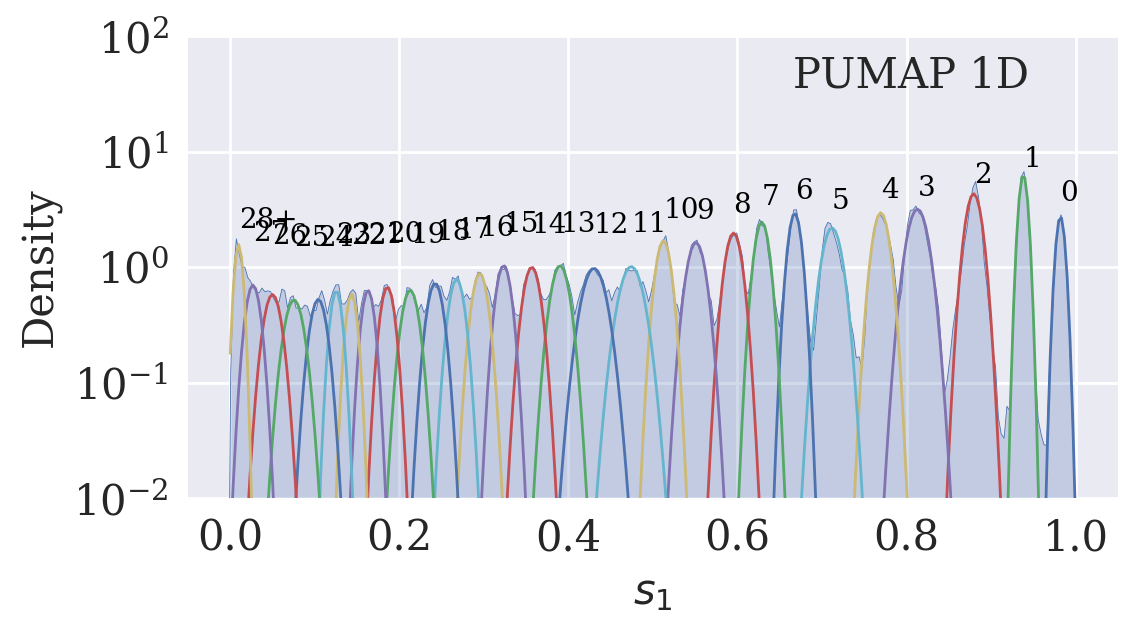
gm.plot_density(
   bw_adjust = 0.03,
   plot_gaussians = True,
   text = name_method,
   save_path = PATH_SAVE_D
)
gm.plot_confidence_1d(expected_prob = expected_prob)
save_results(
   gm = gm,
   name_method = name_method,
   path = PATH_RESULTS
)